. 2011 Jul;31(7):1599-611.
doi: 10.1038/jcbfm.2011.35. Epub 2011 Apr 6.

Physiological origin for the BOLD poststimulus undershoot in human brain: vascular compliance versus oxygen metabolism

Affiliations

Physiological origin for the BOLD poststimulus undershoot in human brain: vascular compliance versus oxygen metabolism

Jun Hua et al. J Cereb Blood Flow Metab. 2011 Jul.

Abstract

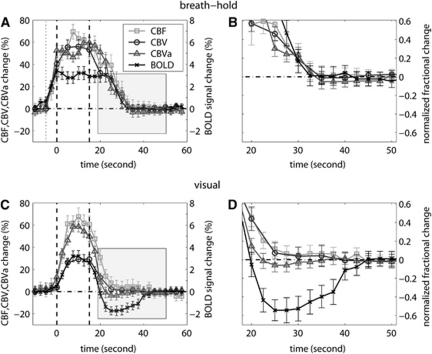
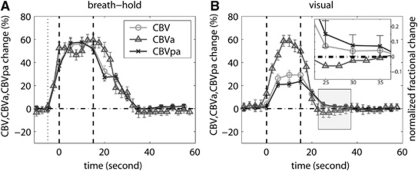
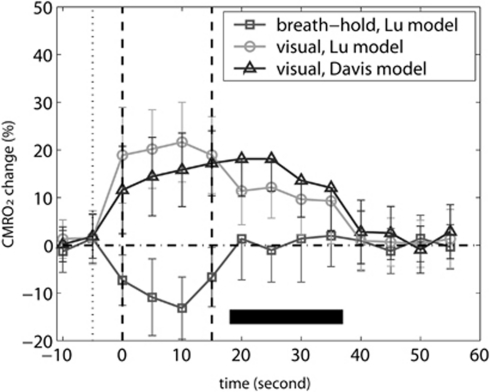
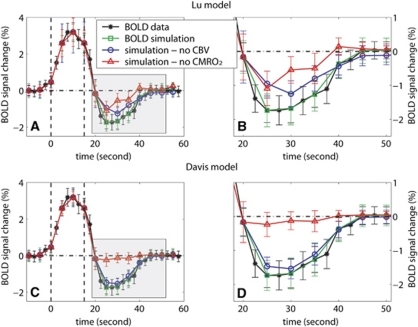
The poststimulus blood oxygenation level-dependent (BOLD) undershoot has been attributed to two main plausible origins: delayed vascular compliance based on delayed cerebral blood volume (CBV) recovery and a sustained increased oxygen metabolism after stimulus cessation. To investigate these contributions, multimodal functional magnetic resonance imaging was employed to monitor responses of BOLD, cerebral blood flow (CBF), total CBV, and arterial CBV (CBV(a)) in human visual cortex after brief breath hold and visual stimulation. In visual experiments, after stimulus cessation, CBV(a) was restored to baseline in 7.9±3.4 seconds, and CBF and CBV in 14.8±5.0 seconds and 16.1±5.8 seconds, respectively, all significantly faster than BOLD signal recovery after undershoot (28.1±5.5 seconds). During the BOLD undershoot, postarterial CBV (CBV(pa), capillaries and venules) was slightly elevated (2.4±1.8%), and cerebral metabolic rate of oxygen (CMRO(2)) was above baseline (10.6±7.4%). Following breath hold, however, CBF, CBV, CBV(a) and BOLD signals all returned to baseline in ∼20 seconds. No significant BOLD undershoot, and residual CBV(pa) dilation were observed, and CMRO(2) did not substantially differ from baseline. These data suggest that both delayed CBV(pa) recovery and enduring increased oxidative metabolism impact the BOLD undershoot. Using a biophysical model, their relative contributions were estimated to be 19.7±15.9% and 78.7±18.6%, respectively.


Figures

Figure 1
Figure 1
Average time courses of cerebral blood flow (CBF, square), cerebral blood volume (CBV; circle), arterial CBV (CBVa; triangle), and blood oxygenation level-dependent (BOLD; cross) evolution during breath-hold (A, B) and visual (C, D) experiments. Time courses were first averaged over all blocks (n=4) and subsequently over all subjects (n=10). Error bars represent intersubject standard deviation. The relative signal changes (ΔS/Sbase) were displayed in A and C. For easier comparison, each time course was normalized by their individual maximum change and the shaded poststimulus periods in A and C were then zoomed in and displayed in B and D, respectively. The vertical dotted line in A denotes the beginning of exhaling before breath hold. The vertical dashed lines in A and C describe the start and end of the stimulus period. In A and C, the scale of CBF, CBV, and CBVa change is labeled on the left and BOLD on the right. In B and D, the scale of the normalized signal (0 to 1) is labeled on the right.
Figure 2
Figure 2
The average time courses of relative blood volume changes (percentage of baseline values) in arterial (arterial cerebral blood volume, CBVa), postarterial (postarterial CBV, CBVpa), and total (CBV) vascular compartments. The error bars represent intersubject standard deviation. For better visualization of small differences, the time courses in B were normalized by their individual peak height and the BOLD poststimulus undershoot period (shaded) was magnified in the inset. The vertical dotted line in A represents the beginning of exhaling before breath hold. The vertical dashed lines in both figures describe the start and end of the stimulation period.
Figure 3
Figure 3
Estimation of cerebral metabolic rate of oxygen (CMRO2) change using the Lu model for breath hold and Lu and Davis models for visual tasks. The CMRO2 time courses were calculated for each subject and then averaged over all subjects (n=10). The error bars represent intersubject standard deviation. For the time period corresponding to the BOLD poststimulus undershoot (20 to 40 seconds, marked by the dark horizontal bar), only the lower bounds of standard deviations are displayed, for the ease of comparing them with the baseline. The vertical dotted and dashed lines depict the beginning of exhaling before breath hold and the start and end of the stimulation period, respectively.
Figure 4
Figure 4
Estimation of the contributions from vascular compliance and sustained increased oxygen consumption to the blood oxygenation level-dependent (BOLD) poststimulus undershoot after visual stimulation obtained from simulating the BOLD signal change by assuming one origin to be absent. The measured BOLD data from the visual task and the BOLD signal changes simulated with original CBF/CBV/CBVa measurements are plotted for reference. The Lu model (A, B) and Davis model (C, D) were employed to simulate BOLD signal changes under the assumptions that: (1) CBV returned to baseline 10 seconds after stimulation cessation (blue, circle) and (2) cerebral metabolic rate of oxygen staying at baseline 10 seconds after stimulus cessation (red, triangle). The time courses were averaged over all subjects (n=10) and the error bars represent intersubject standard deviations. The shaded poststimulus periods in A and C were zoomed in and displayed in B and D, respectively. Note that the temporal resolution of the simulated time courses was limited by the lowest temporal resolution in our data, which is 5 seconds in the CBV measurement. The vertical dashed lines represent the start and end of the visual stimulation period.

Similar articles

Cited by

References

    1. Blockley NP, Francis ST, Gowland PA. Perturbation of the BOLD response by a contrast agent and interpretation through a modified balloon model. NeuroImage. 2009;48:84. - PubMed
    1. Buxton RB. Proc 17th Annual Meeting ISMRM. Hawaii, USA; 2009. Modeling the effect of changes in arterial blood volume on the BOLD signal; p. 1620.
    1. Buxton RB, Wong EC, Frank LR. Dynamics of blood flow and oxygenation changes during brain activation: the balloon model. Magn Reson Med. 1998;39:855. - PubMed
    1. Chen JJ, Pike GB. Origins of the BOLD post-stimulus undershoot. NeuroImage. 2009;46:559. - PubMed
    1. Davis TL, Kwong KK, Weisskoff RM, Rosen BR. Calibrated functional MRI: mapping the dynamics of oxidative metabolism. Proc Natl Acad Sci USA. 1998;95:1834–1839. - PMC - PubMed

Publication types