

Methyl-β-cyclodextrins preferentially remove cholesterol from the liquid disordered phase in giant unilamellar vesicles
- PMID: 21468650
- PMCID: PMC3082695
- DOI: 10.1007/s00232-011-9348-8
Methyl-β-cyclodextrins preferentially remove cholesterol from the liquid disordered phase in giant unilamellar vesicles
Abstract
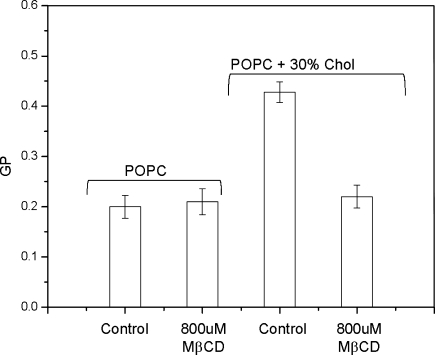
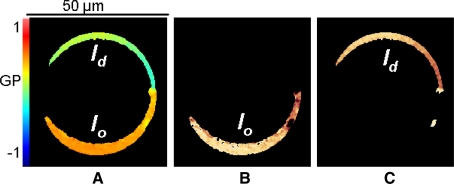
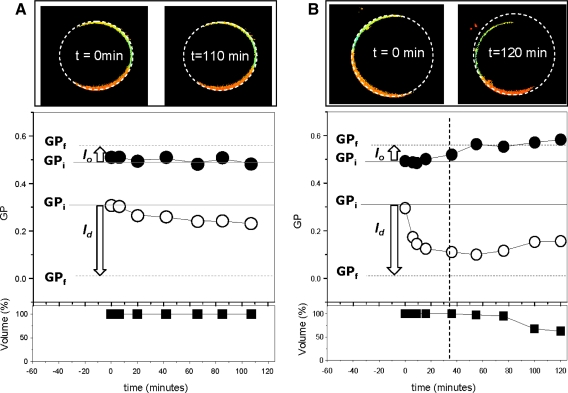
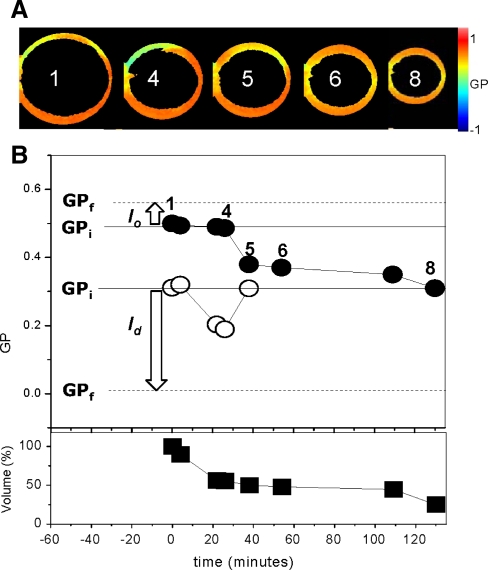
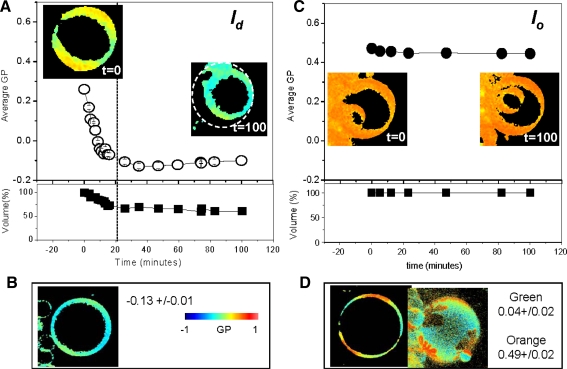
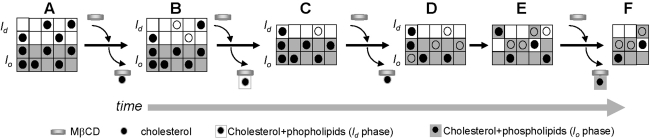
Methyl-β-cyclodextrins (MβCDs) are molecules that are extensively used to remove and to load cholesterol (Chol) from artificial and natural membranes; however, the mechanism of Chol extraction by MβCD from pure lipids or from complex mixtures is not fully understood. One of the outstanding questions in this field is the capability of MβCD to remove Chol from lipid domains having different packing. Here, we investigated the specificity of MβCD to remove Chol from coexisting macrodomains with different lipid packing. We used giant unilamellar vesicles (GUVs) made of 1,2-dioleoylphosphatidylcholine:1,2-dipalmitoylphatidylcholine:free cholesterol, 1:1:1 molar ratio at 27°C. Under these conditions, individual GUVs present Chol distributed into lo and ld phases. The two phases can be distinguished and visualized using Laurdan generalized polarization and two-photon excitation fluorescence microscopy. Our data indicate that MβCD removes Chol preferentially from the more disordered phase. The process of selective Chol removal is dependent on the MβCD concentration. At high concentrations, MβCD also removes phospholipids.
Figures
Similar articles
-
Membrane fluidity and lipid order in ternary giant unilamellar vesicles using a new bodipy-cholesterol derivative.Biophys J. 2009 Apr 8;96(7):2696-708. doi: 10.1016/j.bpj.2008.12.3922. Biophys J. 2009. PMID: 19348752 Free PMC article.
-
Phase diagram of a polyunsaturated lipid mixture: Brain sphingomyelin/1-stearoyl-2-docosahexaenoyl-sn-glycero-3-phosphocholine/cholesterol.Biochim Biophys Acta. 2016 Jan;1858(1):153-61. doi: 10.1016/j.bbamem.2015.10.016. Epub 2015 Oct 23. Biochim Biophys Acta. 2016. PMID: 26525664 Free PMC article.
-
Role of Aminophospholipids in the Formation of Lipid Rafts in Model Membranes.J Fluoresc. 2015 Jul;25(4):1037-43. doi: 10.1007/s10895-015-1589-y. Epub 2015 Jun 16. J Fluoresc. 2015. PMID: 26076930
-
Lipid packing determines protein-membrane interactions: challenges for apolipoprotein A-I and high density lipoproteins.Biochim Biophys Acta. 2010 Jul;1798(7):1399-408. doi: 10.1016/j.bbamem.2010.03.019. Epub 2010 Mar 27. Biochim Biophys Acta. 2010. PMID: 20347719 Free PMC article. Review.
-
Evolution and development of model membranes for physicochemical and functional studies of the membrane lateral heterogeneity.Biochim Biophys Acta Biomembr. 2018 Oct;1860(10):2012-2017. doi: 10.1016/j.bbamem.2018.03.010. Epub 2018 Mar 14. Biochim Biophys Acta Biomembr. 2018. PMID: 29550290 Review.
Cited by
-
Cellular Cholesterol Distribution Influences Proteolytic Release of the LRP-1 Ectodomain.Front Pharmacol. 2016 Feb 12;7:25. doi: 10.3389/fphar.2016.00025. eCollection 2016. Front Pharmacol. 2016. PMID: 26903870 Free PMC article.
-
Measuring plasma membrane fluidity using confocal microscopy.Nat Protoc. 2025 Jul;20(7):1976-2004. doi: 10.1038/s41596-024-01122-8. Epub 2025 Feb 19. Nat Protoc. 2025. PMID: 39972239 Review.
-
Shape Transformations of Lipid Bilayers Following Rapid Cholesterol Uptake.Biophys J. 2016 Dec 20;111(12):2651-2657. doi: 10.1016/j.bpj.2016.11.016. Biophys J. 2016. PMID: 28002741 Free PMC article.
-
Pharmacological and Genetic Inhibition of Caveolin-1 Promotes Epithelialization and Wound Closure.Mol Ther. 2019 Nov 6;27(11):1992-2004. doi: 10.1016/j.ymthe.2019.07.016. Epub 2019 Jul 30. Mol Ther. 2019. PMID: 31409528 Free PMC article.
-
Sterol targeting drugs reveal life cycle stage-specific differences in trypanosome lipid rafts.Sci Rep. 2017 Aug 22;7(1):9105. doi: 10.1038/s41598-017-08770-9. Sci Rep. 2017. PMID: 28831063 Free PMC article.
References
-
- Angelova MI, Dimitrov DS. Liposome electroformation. Faraday Discuss Chem Soc. 1986;81:303–311. doi: 10.1039/dc9868100303. - DOI
-
- Angelova MI, Soleau S, Meleard P, Faucon JF, Bothorel P. Preparation of giant vesicles by external fields. Kinetics and application. Prog Colloid Polym Sci. 1992;89:127–131. doi: 10.1007/BFb0116295. - DOI
Publication types
MeSH terms
Substances
Grants and funding
LinkOut - more resources
Full Text Sources
Medical
Research Materials
