. 2011 Apr;11(2):188-95.
doi: 10.2174/187152611795589717.

Chromium-picolinate therapy in diabetes care: molecular and subcellular profiling revealed a necessity for individual outcome prediction, personalised treatment algorithms and new guidelines

Affiliations

Chromium-picolinate therapy in diabetes care: molecular and subcellular profiling revealed a necessity for individual outcome prediction, personalised treatment algorithms and new guidelines

Kristina Yeghiazaryan et al. Infect Disord Drug Targets. 2011 Apr.

Abstract

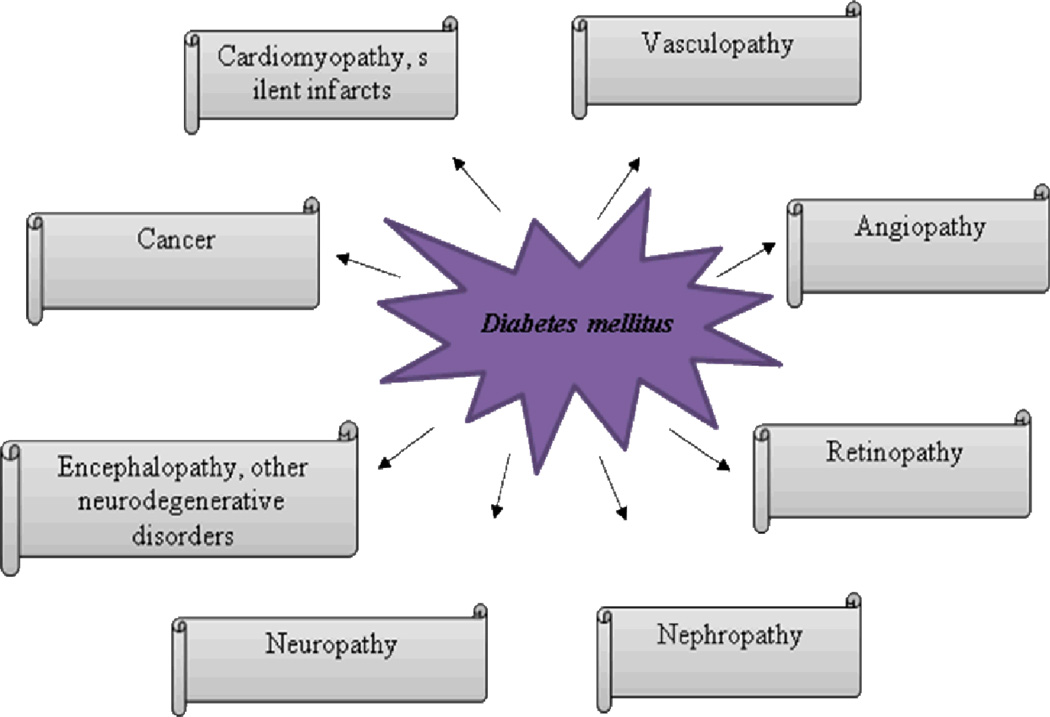
Aims: Global figures clearly demonstrate inadequacy of current diabetes care: every 10 seconds one patient dies of diabetes-related pathologies. Nephropathy is the leading secondary complication of the disease. Nutritional supplement by chromium-picolinate is assumed to have beneficial therapeutic effects. However, potential toxic effects reported increase concerns about safety of chromium-picolinate. The experimental design aimed at determining, whether the treatment with clinically relevant doses of chromium-picolinate can harm through DNA damage and extensive alterations in central detoxification / cell-cycle regulating pathways in treatment of diabetes.

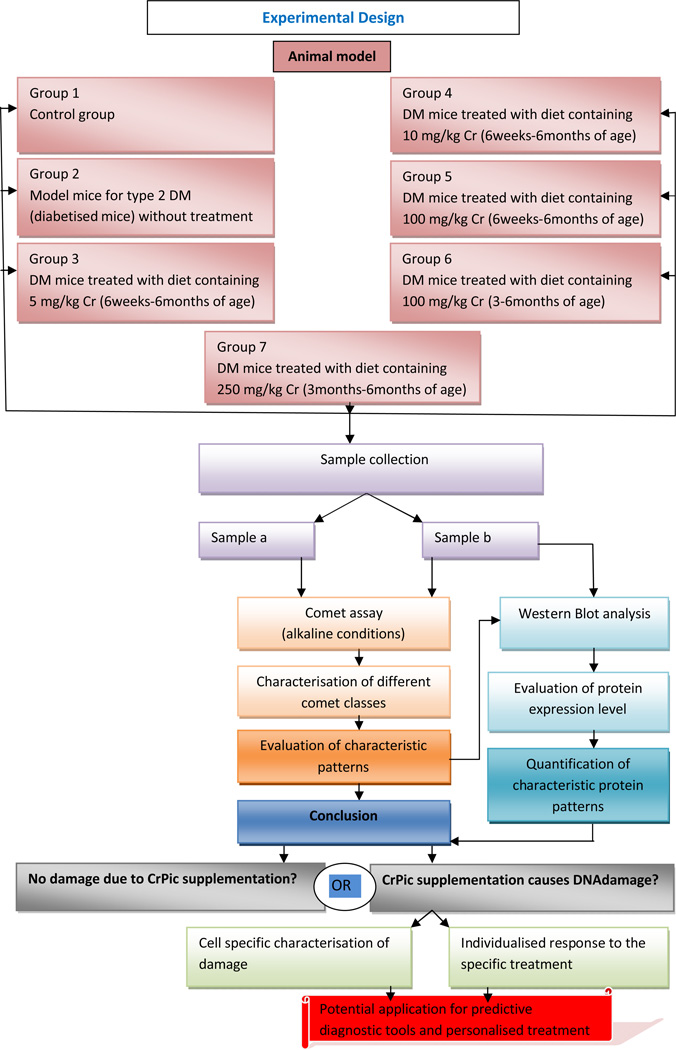
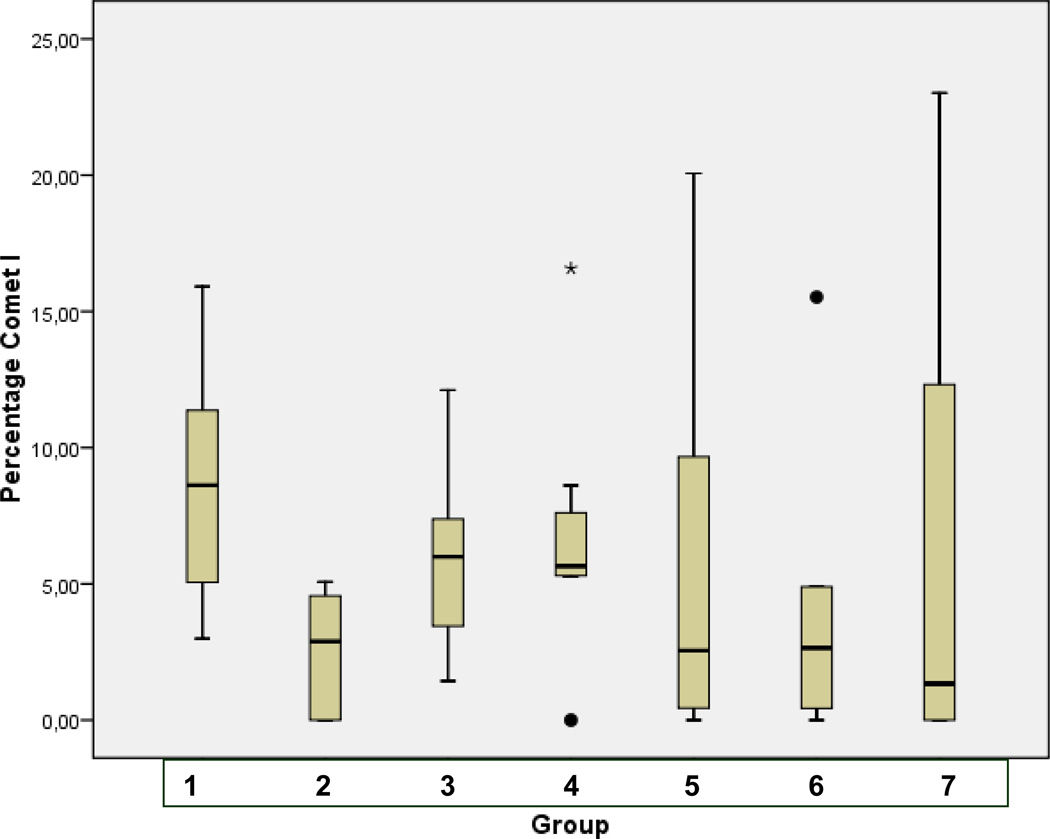
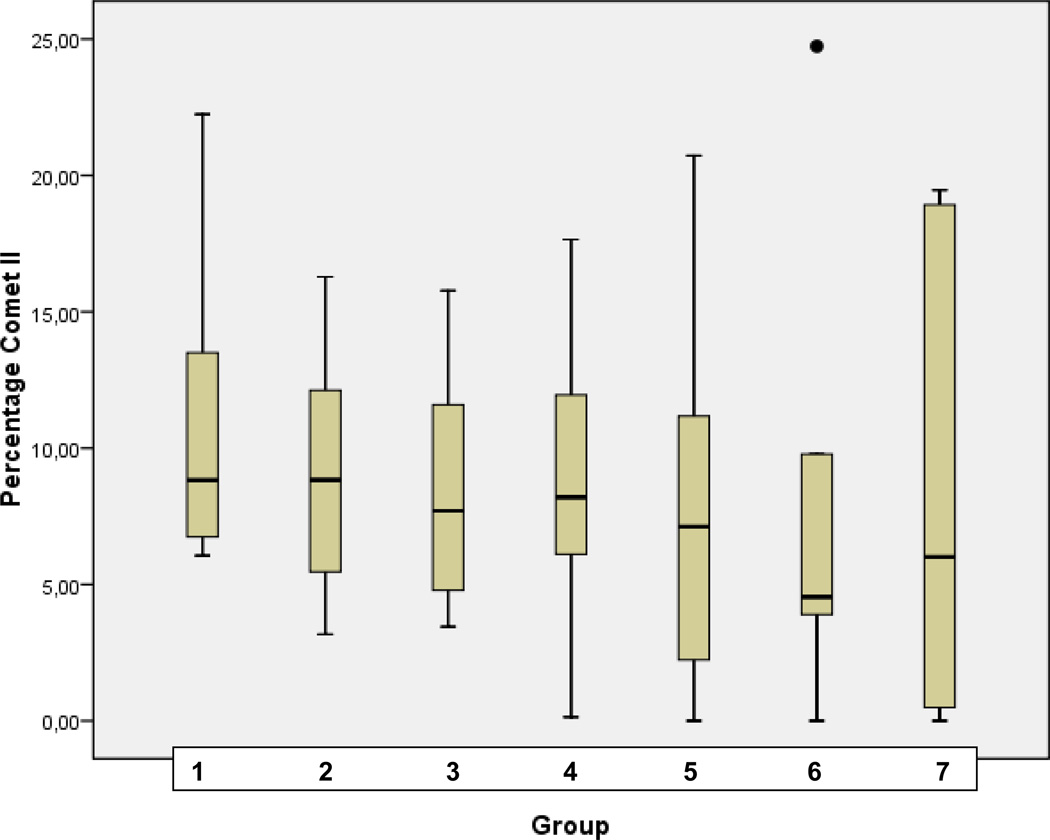
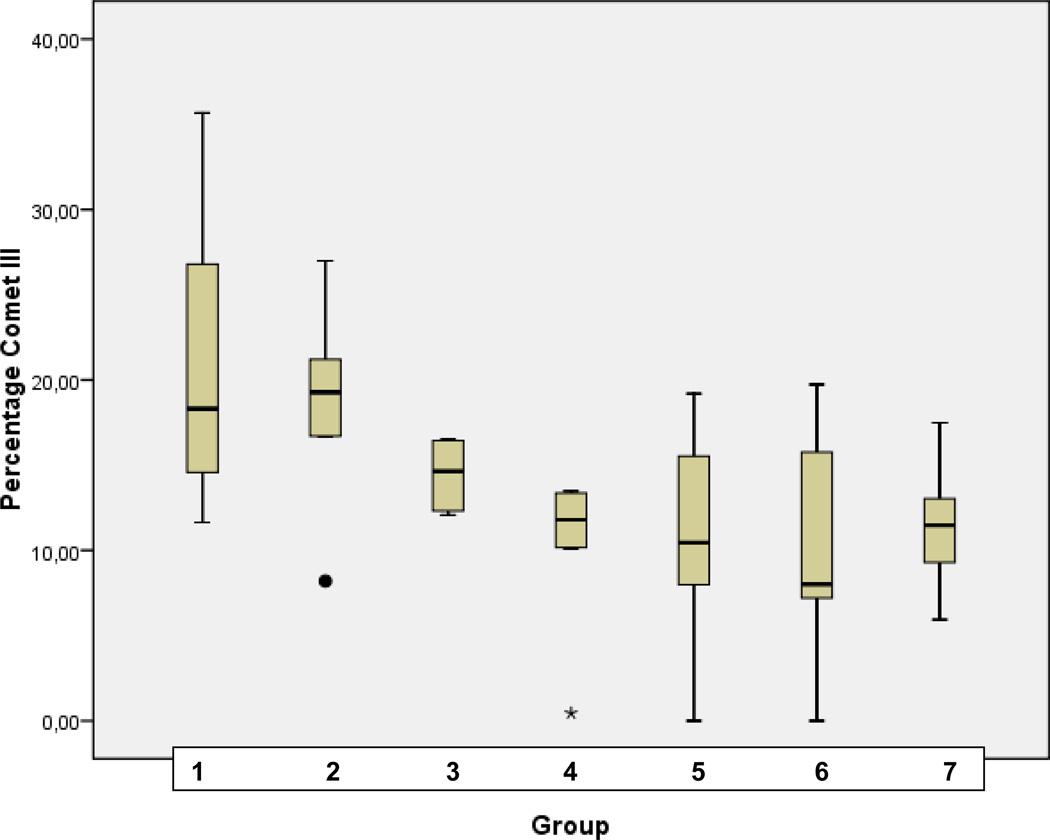
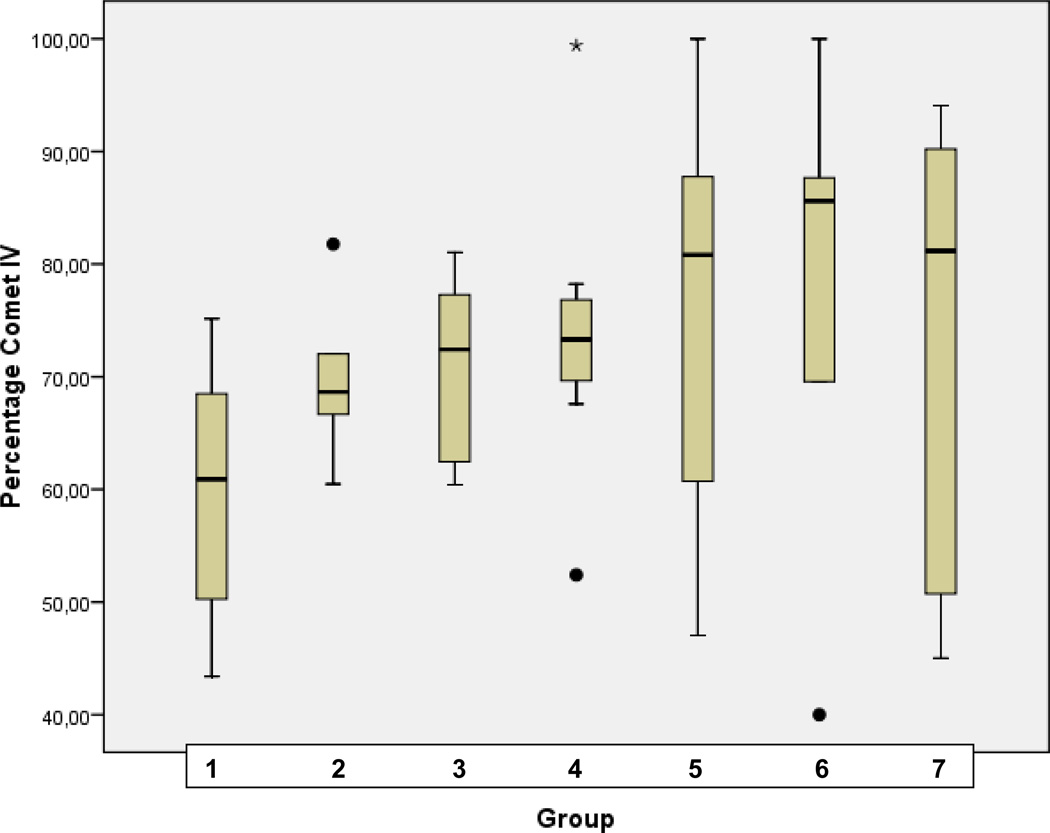
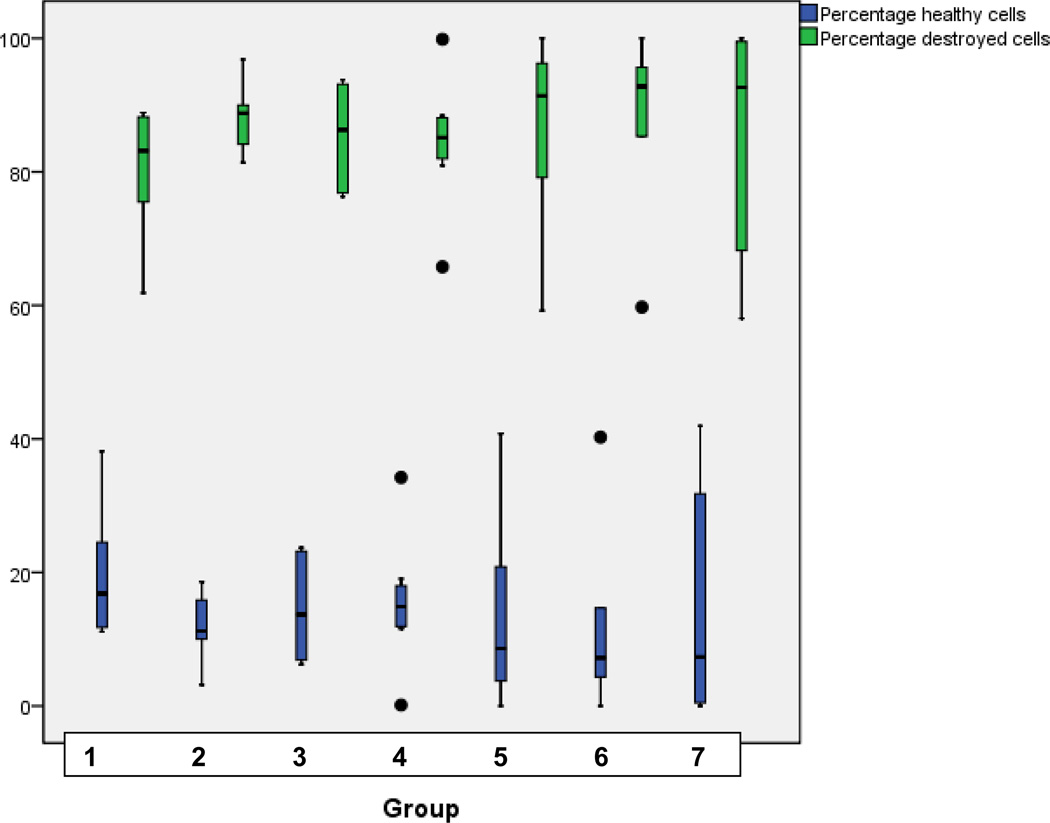
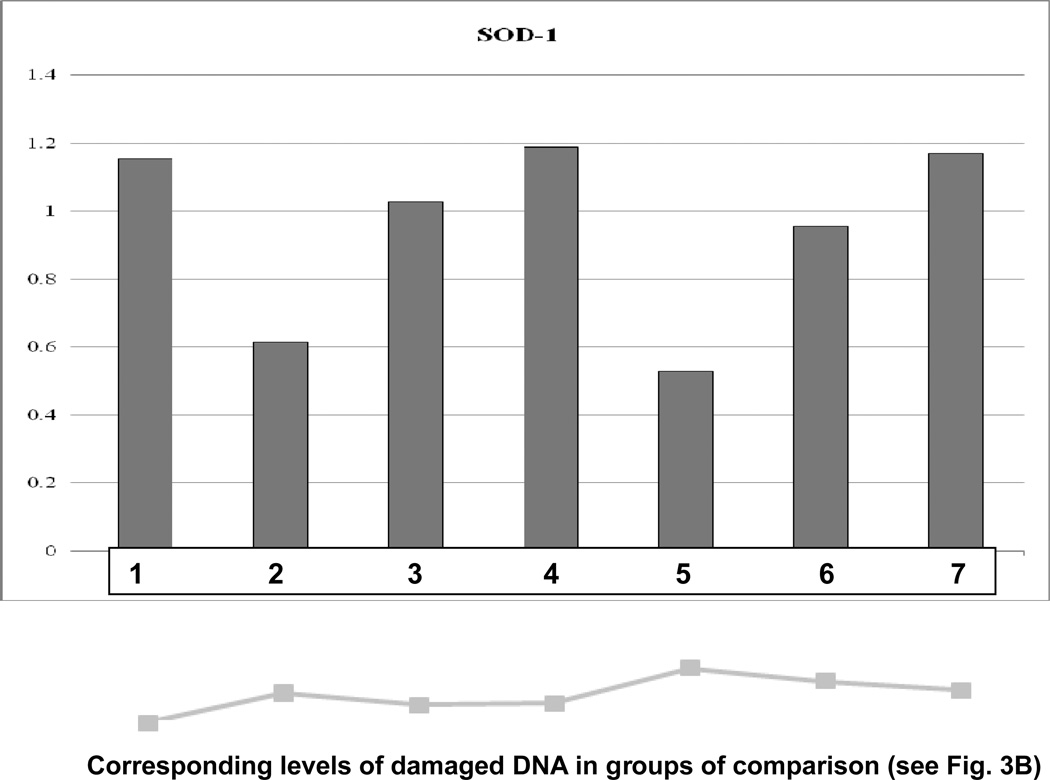
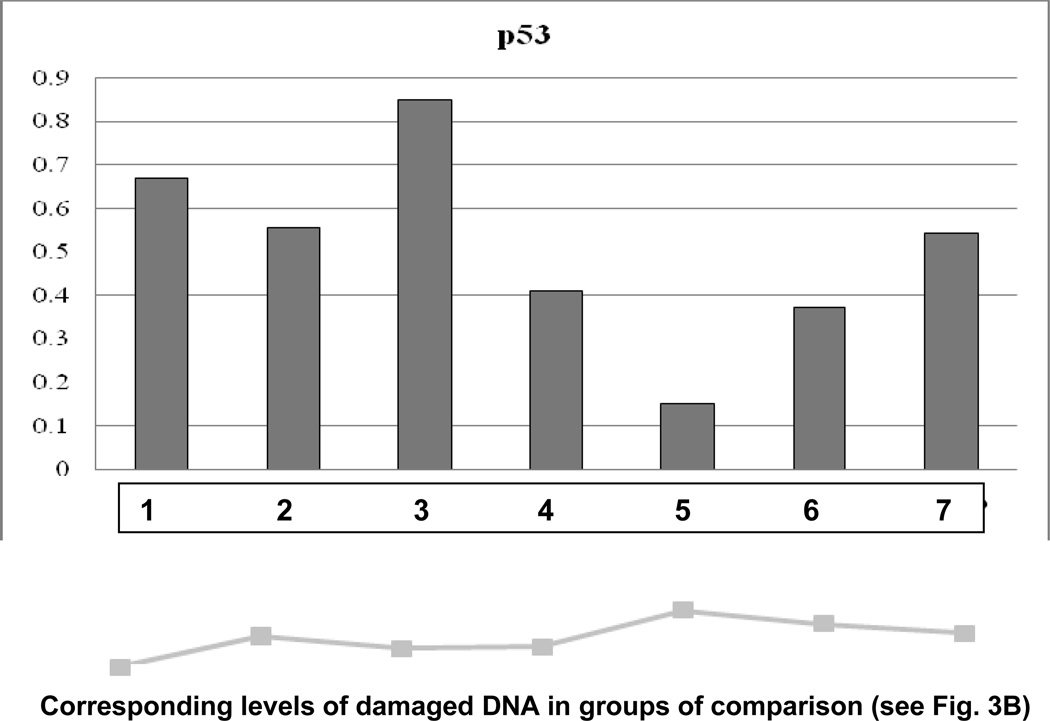
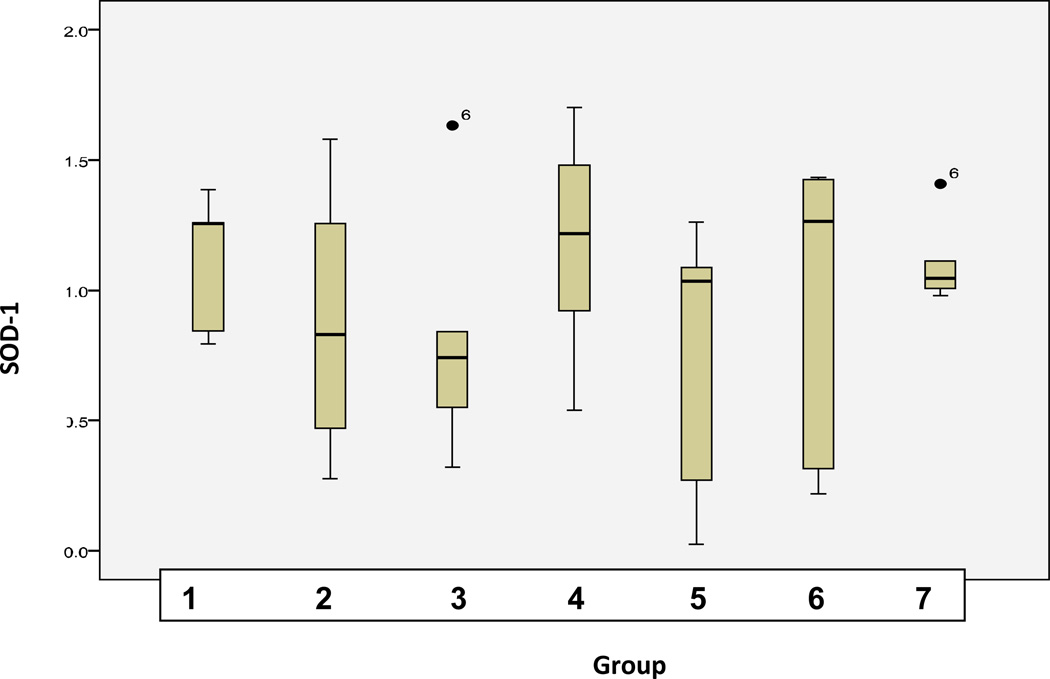
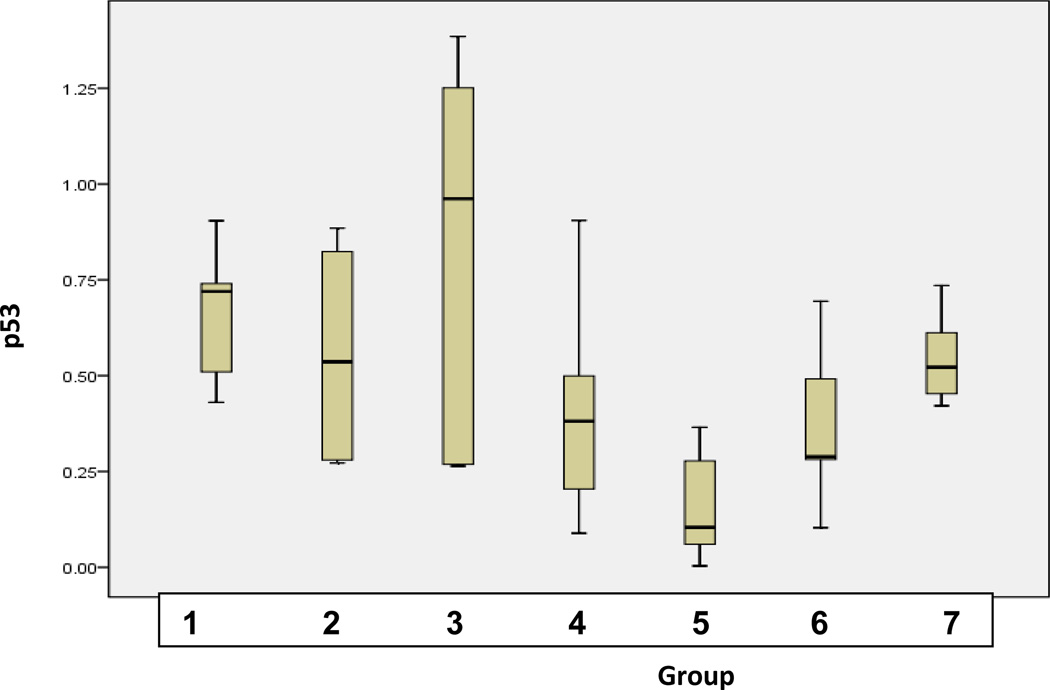
Methods: Well-acknowledged animal model of db/db-mice and clinically relevant doses of chromium-picolinate were used. As an index of DNA-damage, measurement of DNA-breaks was performed using "Comet Assay"-analysis. Individual and group-specific expression patterns of SOD-1 and P53 were evaluated to give a clue about central detoxification and cell-cycle regulating pathways under treatment conditions. The study was performed in a double-blind manner.

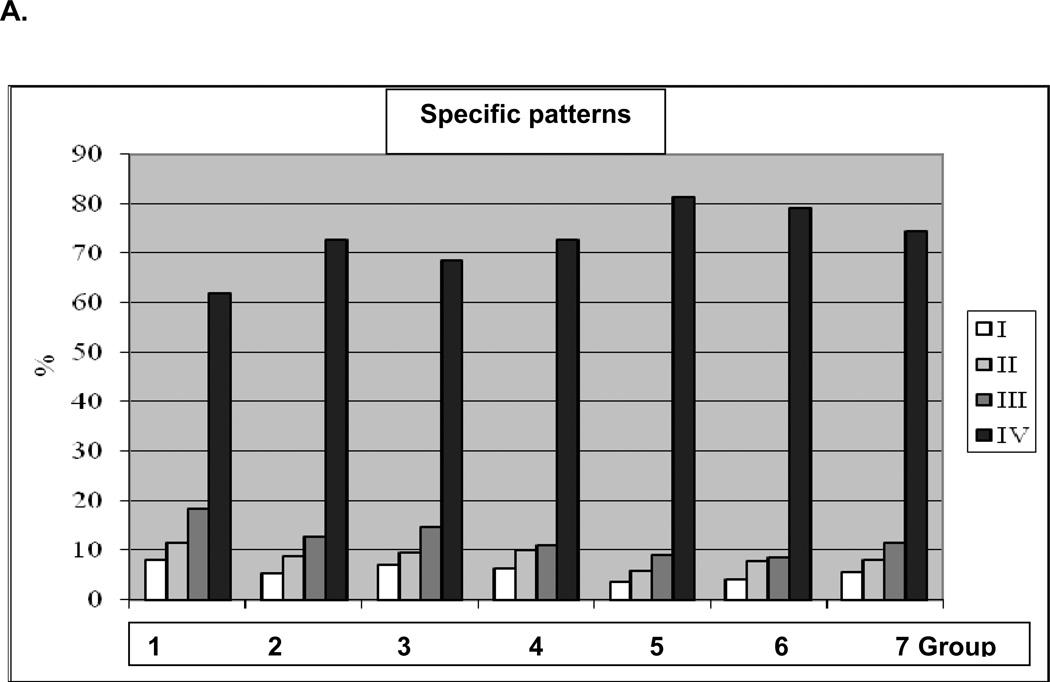
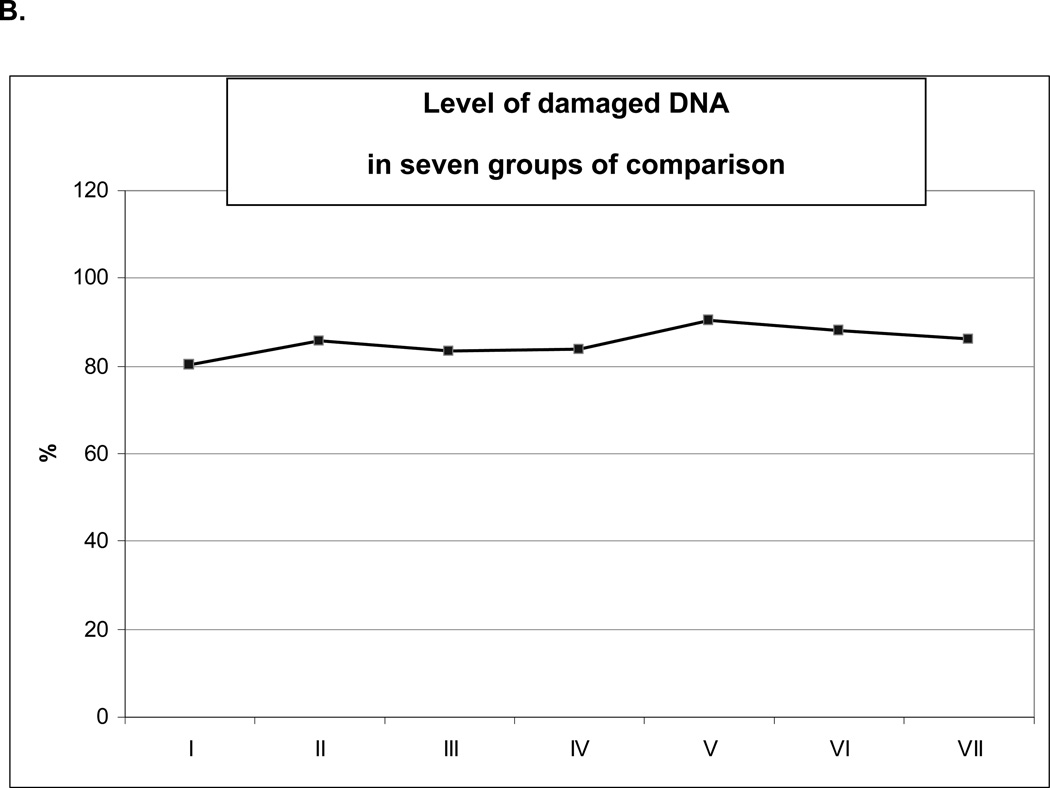
Results: Experimental data revealed highly individual reaction under treatment conditions. However, group-specific patterns were monitored: highest amount of damaged DNA--under the longest treatment with high doses, in contrast to groups with low doses of chromium-picolinate. Comet patterns were intermediate between untreated diabetised and control animals. Expression patterns demonstrated a correlation with subcellular imaging and dosage-dependent suppression under chromium-picolinate treatment.

Conclusions: This article highlights possible risks for individual long-term effects, when chromium-picolinate is used freely as a therapeutic nutritional modality agent without application of advanced diagnostic tools to predict risks and individual outcomes. Targeted measures require a creation of new guidelines for advanced Diabetes care.


Figures

Figure 1
Figure 1
Chronic complications associated with DM (15).
Figure 2
Figure 2
Experimental design
Figure 3
Figure 3
A. Comet patterns characteristic for each group of comparison. B. Corresponding persentage of class III and IV comets representing damaged DNA in groups of comparison.
Figure 3
Figure 3
A. Comet patterns characteristic for each group of comparison. B. Corresponding persentage of class III and IV comets representing damaged DNA in groups of comparison.
Figure 4
Figure 4
A. Statistical analyses for Comets type I in groups of comparison as described in Figure 2 (“Experimental design”). Analyses were carried out using SPSS 17.0 software (SPSS, Chicago, USA) by the application of univariable variance analyse Bonferroni. B. Statistical analyses for Comets type II in groups of comparison as described in Figure 2 (“Experimental design”). Analyses were carried out using SPSS 17.0 software (SPSS, Chicago, USA) by the application of univariable variance analyse Bonferroni. C. Statistical analyses for Comets type III in groups of comparison as described in Figure 2 (“Experimental design”). Analyses were carried out using SPSS 17.0 software (SPSS, Chicago, USA) by the application of univariable variance analyse Bonferroni. D. Statistical analyses for Comets type IV in groups of comparison as described in Figure 2 (“Experimental design”). Analyses were carried out using SPSS 17.0 software (SPSS, Chicago, USA) by the application of univariable variance analyse Bonferroni. E. Statistical analyses for the ratio healthy (class I comets) versus damaged cells (classes II, III and IV comets) in groups of comparison as described in Figure 2 (“Experimental design”). Analyses were carried out using SPSS 17.0 software (SPSS, Chicago, USA) by the application of univariable variance analyse Bonferroni.
Figure 4
Figure 4
A. Statistical analyses for Comets type I in groups of comparison as described in Figure 2 (“Experimental design”). Analyses were carried out using SPSS 17.0 software (SPSS, Chicago, USA) by the application of univariable variance analyse Bonferroni. B. Statistical analyses for Comets type II in groups of comparison as described in Figure 2 (“Experimental design”). Analyses were carried out using SPSS 17.0 software (SPSS, Chicago, USA) by the application of univariable variance analyse Bonferroni. C. Statistical analyses for Comets type III in groups of comparison as described in Figure 2 (“Experimental design”). Analyses were carried out using SPSS 17.0 software (SPSS, Chicago, USA) by the application of univariable variance analyse Bonferroni. D. Statistical analyses for Comets type IV in groups of comparison as described in Figure 2 (“Experimental design”). Analyses were carried out using SPSS 17.0 software (SPSS, Chicago, USA) by the application of univariable variance analyse Bonferroni. E. Statistical analyses for the ratio healthy (class I comets) versus damaged cells (classes II, III and IV comets) in groups of comparison as described in Figure 2 (“Experimental design”). Analyses were carried out using SPSS 17.0 software (SPSS, Chicago, USA) by the application of univariable variance analyse Bonferroni.
Figure 5
Figure 5
A. Specific expression patterns of SOD-1 monitored for each group of comparison. The expression levels were analyzed by “Western-blot”. Normalized median values are represented. Expression rates of the target protein were normalized by corresponding rates of β-actin - the house keeping gene. The below graph shows percentage of corresponding amount of damaged DNA measured at subcellular level by “Comet Assay”-analysis. B. Specific expression patterns of P53 monitored for each group of comparison. The expression levels were analyzed by “Western-blot”. Normalized median values are represented. Expression rates of the target protein were normalized by corresponding rates of β-actin, the house keeping gene. The below graph shows percentage of corresponding amount of damaged DNA measured at subcellular level by “Comet Assay”-analysis.
Figure 5
Figure 5
A. Specific expression patterns of SOD-1 monitored for each group of comparison. The expression levels were analyzed by “Western-blot”. Normalized median values are represented. Expression rates of the target protein were normalized by corresponding rates of β-actin - the house keeping gene. The below graph shows percentage of corresponding amount of damaged DNA measured at subcellular level by “Comet Assay”-analysis. B. Specific expression patterns of P53 monitored for each group of comparison. The expression levels were analyzed by “Western-blot”. Normalized median values are represented. Expression rates of the target protein were normalized by corresponding rates of β-actin, the house keeping gene. The below graph shows percentage of corresponding amount of damaged DNA measured at subcellular level by “Comet Assay”-analysis.
Figure 6
Figure 6
A. Statistical analyses of expression levels of SOD-1 measured in groups of comparison as described in Figure 2 (“Experimental design”). Analyses were carried out using SPSS 17.0 software (SPSS, Chicago, USA) by the application of univariable variance analysis Bonferroni. B. Statistical analyses of expression levels of SOD-1 measured in groups of comparison as described in Figure 2 (“Experimental design”). Analyses were carried out using SPSS 17.0 software (SPSS, Chicago, USA) by the application of univariable variance analysis Bonferroni.
Figure 6
Figure 6
A. Statistical analyses of expression levels of SOD-1 measured in groups of comparison as described in Figure 2 (“Experimental design”). Analyses were carried out using SPSS 17.0 software (SPSS, Chicago, USA) by the application of univariable variance analysis Bonferroni. B. Statistical analyses of expression levels of SOD-1 measured in groups of comparison as described in Figure 2 (“Experimental design”). Analyses were carried out using SPSS 17.0 software (SPSS, Chicago, USA) by the application of univariable variance analysis Bonferroni.

Similar articles

Cited by

References

    1. Rahim MA, Hussain A, Azad Khan AK, Sayeed MA, Keramat Ali SM, Vaaler S. Rising prevalence of type 2 diabetes in rural Bangladesh: a population based study. Diabetes Res Clin Pract. 2007;77:300–305. - PubMed
    1. Nolan JJ, O'Halloran D, McKenna TJ, Firth R, Redmond S. The cost of treating type 2 diabetes (CODEIRE) Ir Med J. 2006;99:307–310. - PubMed
    1. Wild S, Roglic G, Green A, Sicree R, King H. Global prevalence of diabetes: estimates for the year 2000 and projections for 2030. Diabetes Care. 2004;27:1047–1053. - PubMed
    1. Azimi-Nezhad M, Ghayour-Mobarhan M, Parizadeh MR, Safarian M, Esmaeili H, Parizadeh SM, Khodaee G, Hosseini J, Abasalti Z, Hassankhani B, Ferns G. Prevalence of type 2 diabetes mellitus in Iran and its relationship with gender, urbanisation, education, marital status and occupation. Singapore Med J. 2008;49:571–576. - PubMed
    1. Cebioglu M, Golubnitschaja O. New tendencies in the epidemiology of Diabetes Mellitus. In: Golubnitschaja O, editor. Predictive Diagnostics and Personalized Treatment: Dream or Reality. Nova Science Publishers, Inc; 2009. pp. 151–156.

Publication types