. 2011 Jun 15;198(2):158-71.
doi: 10.1016/j.jneumeth.2011.03.012. Epub 2011 Apr 4.

Corrosion of tungsten microelectrodes used in neural recording applications

Affiliations

Corrosion of tungsten microelectrodes used in neural recording applications

Erin Patrick et al. J Neurosci Methods. .

Abstract

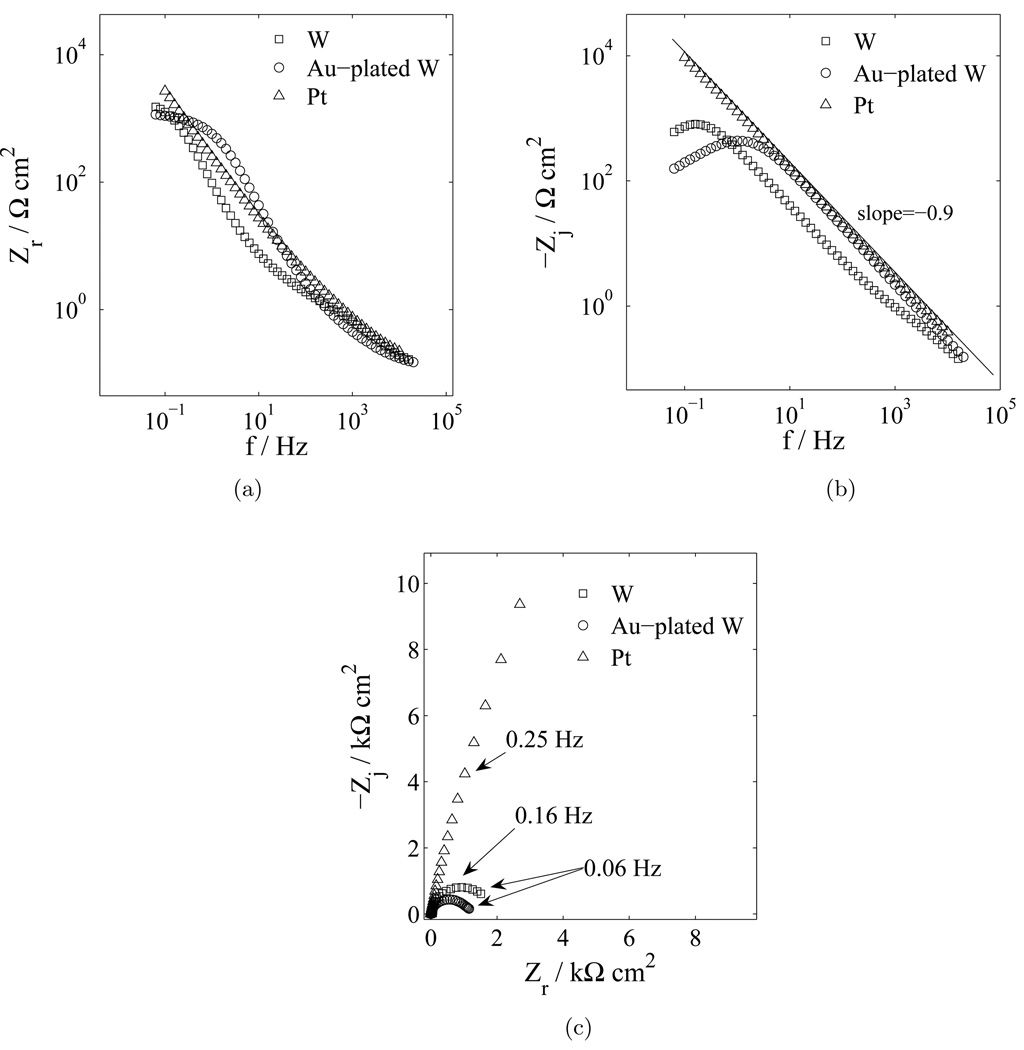
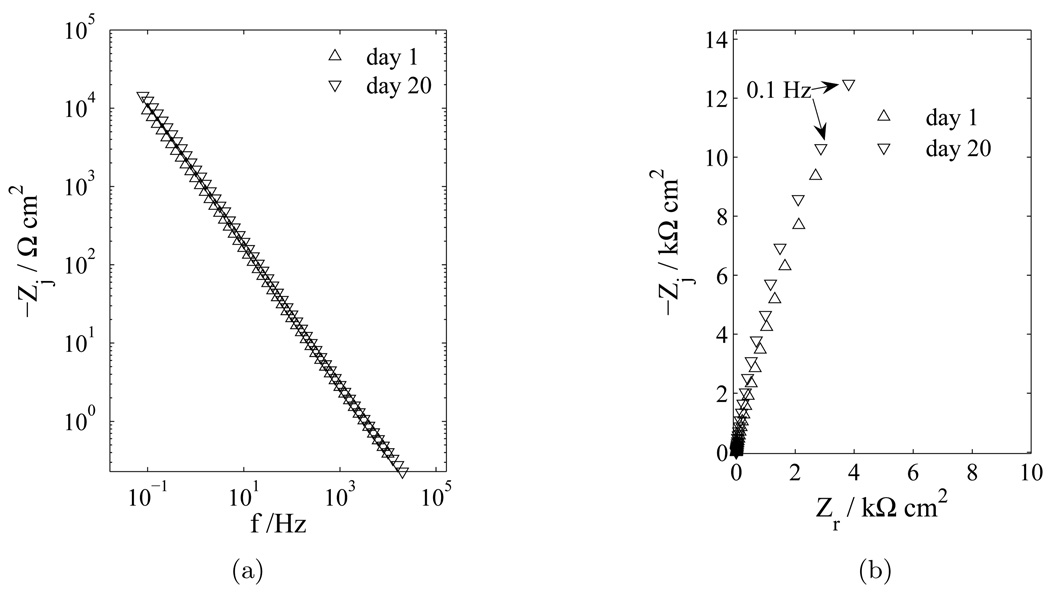
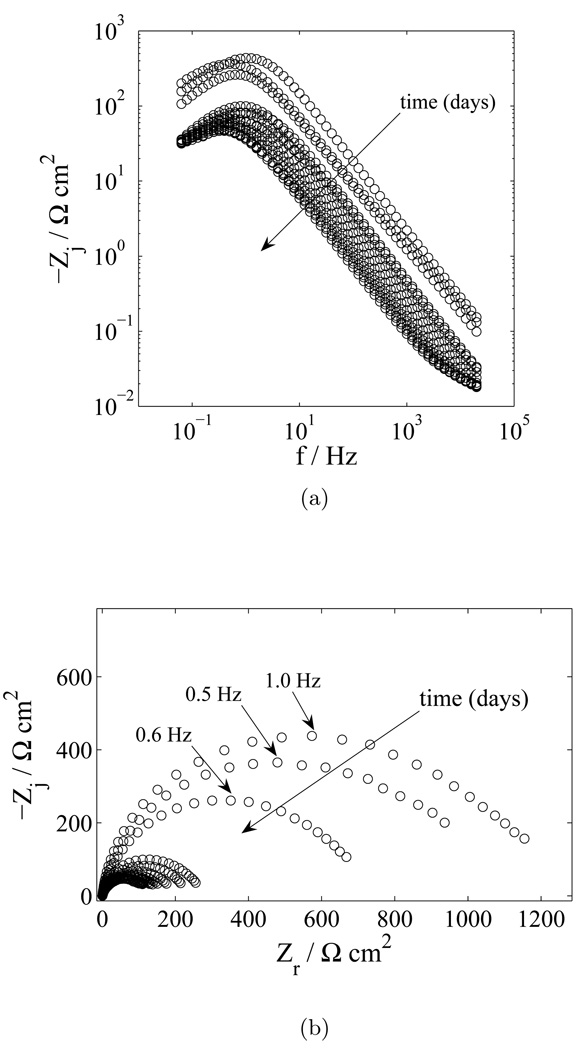
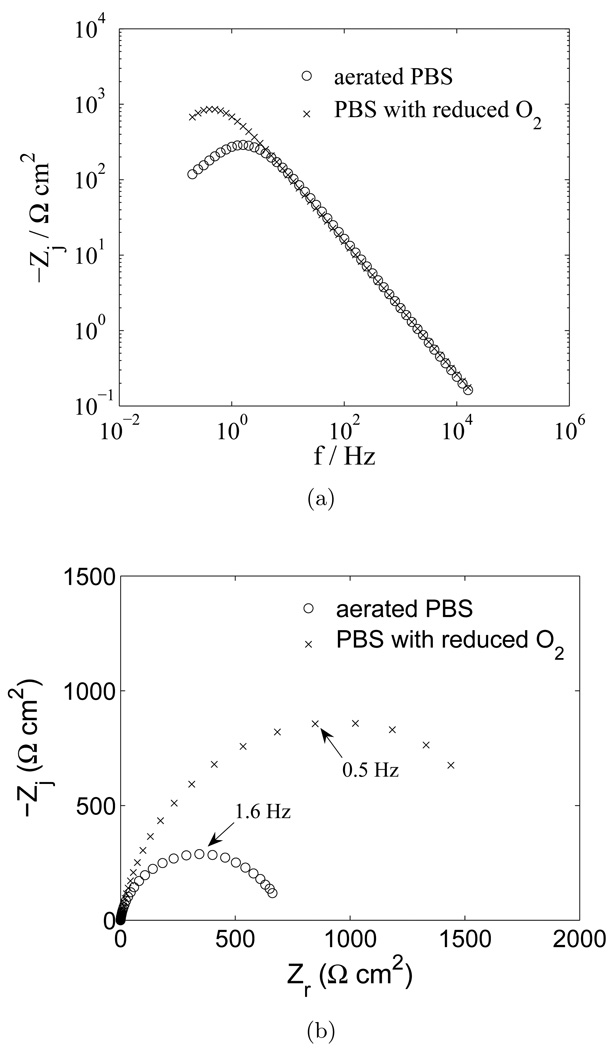
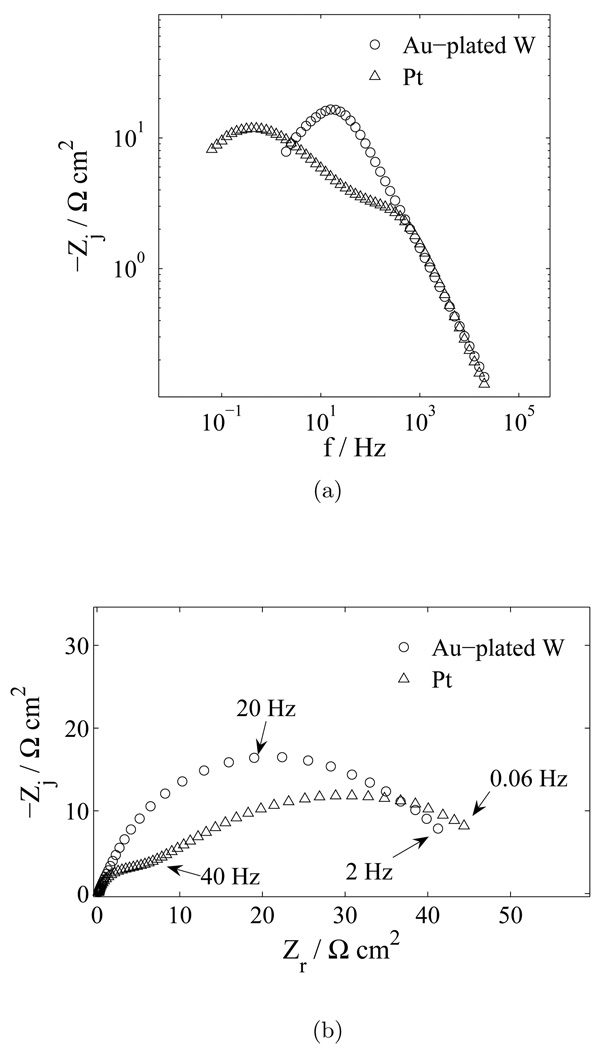
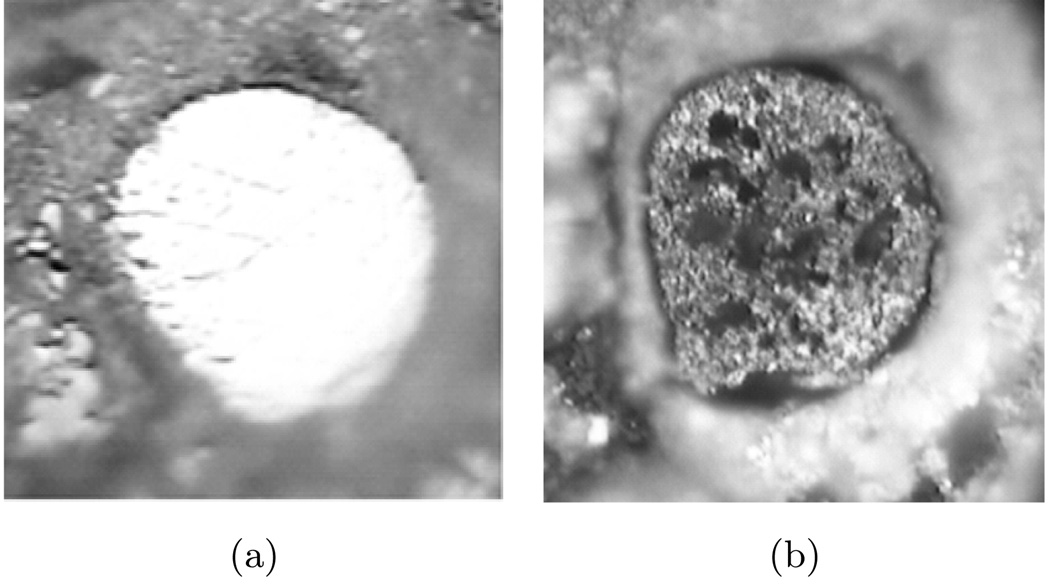
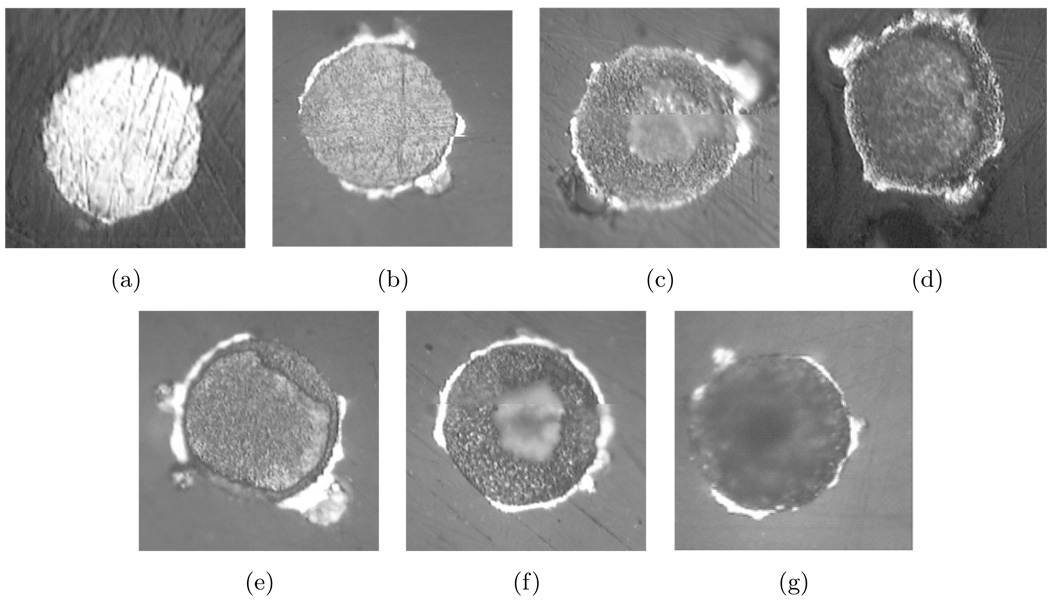
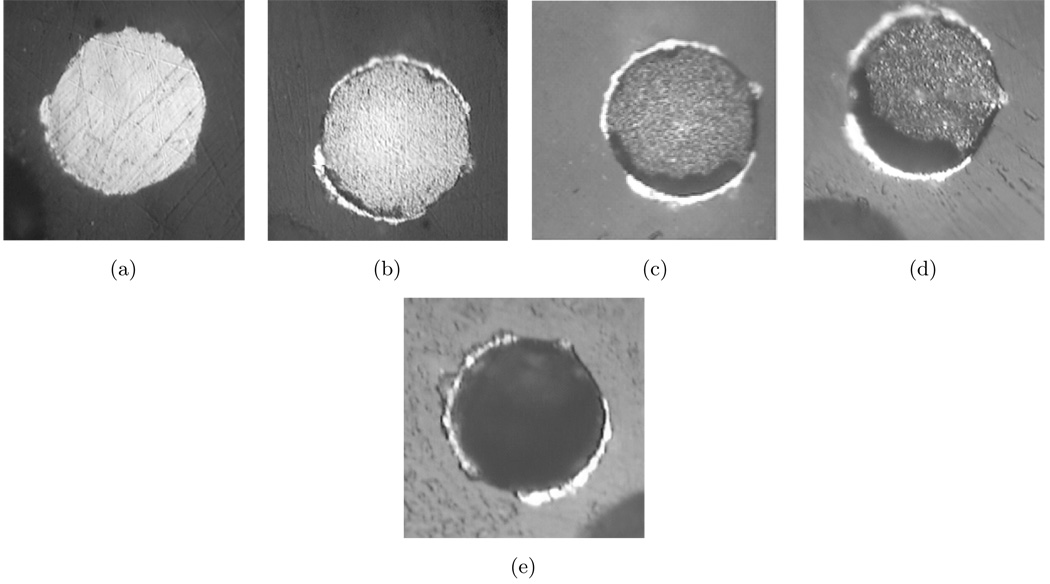
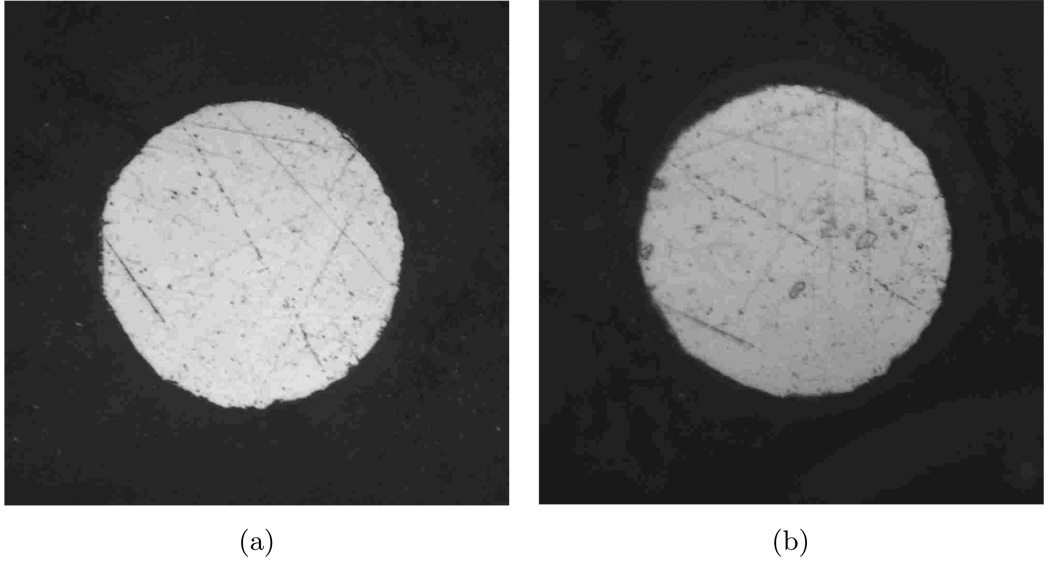
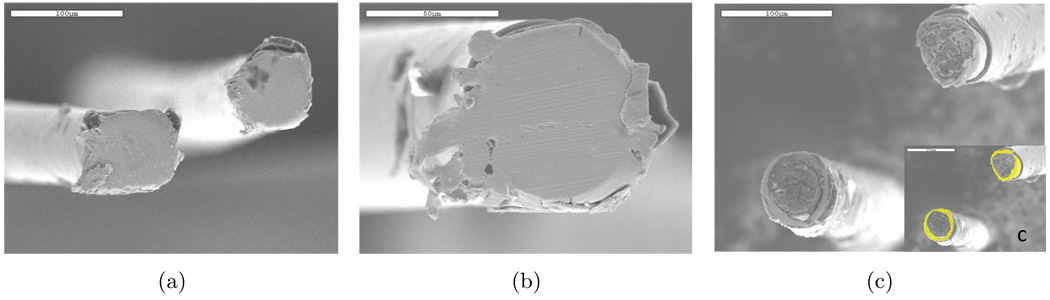
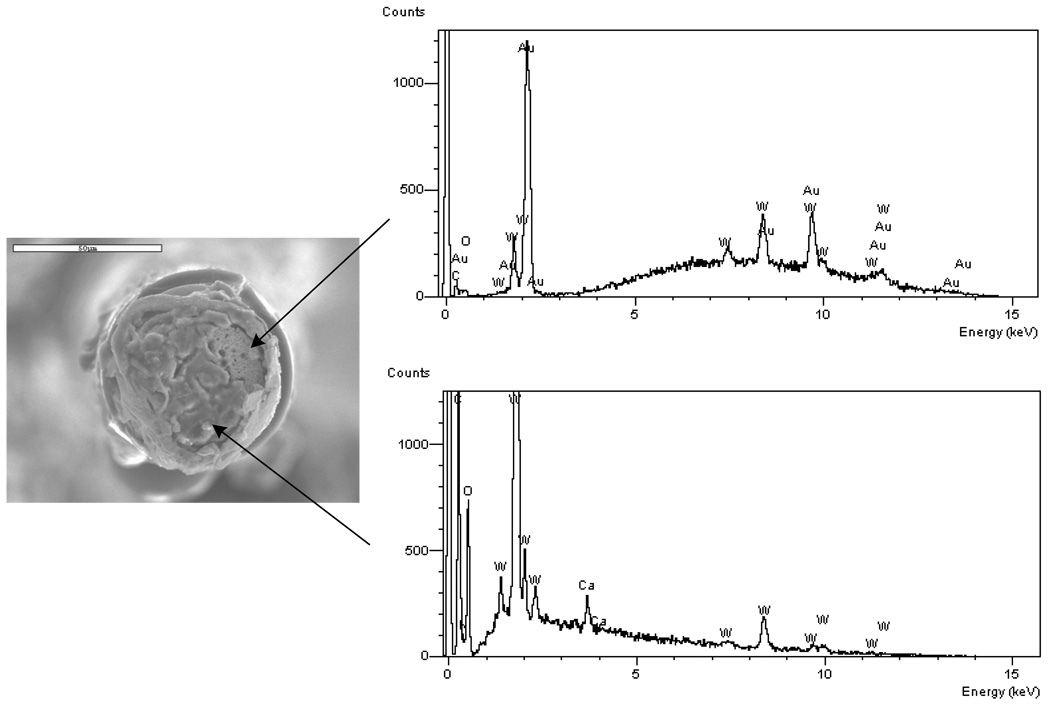
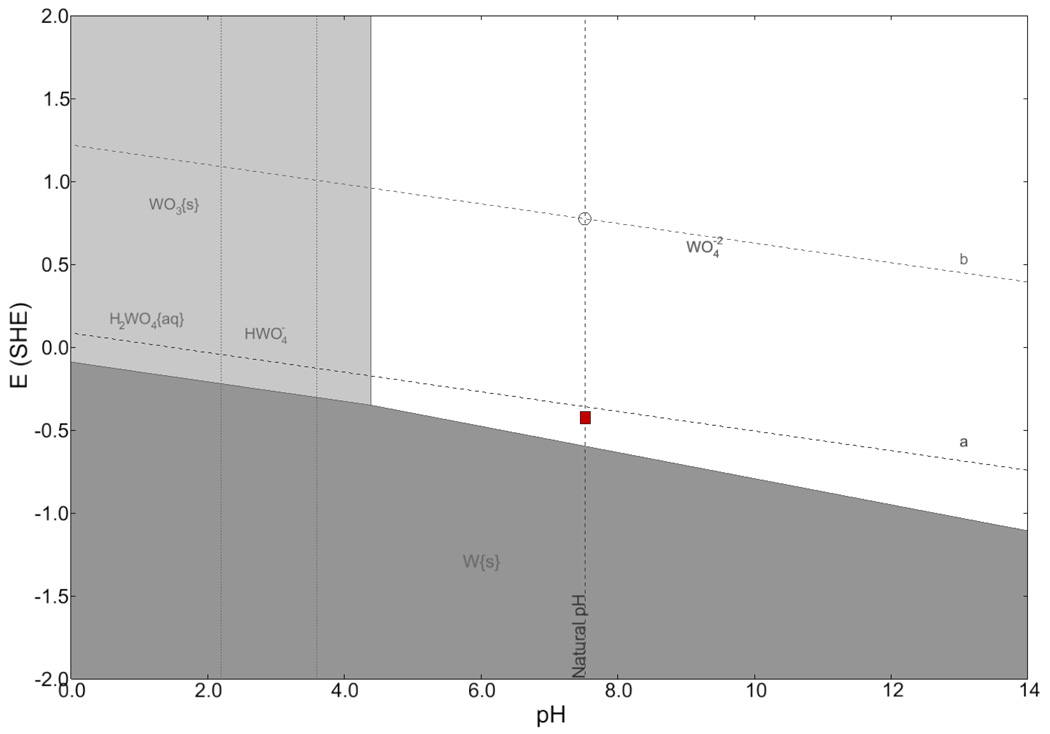
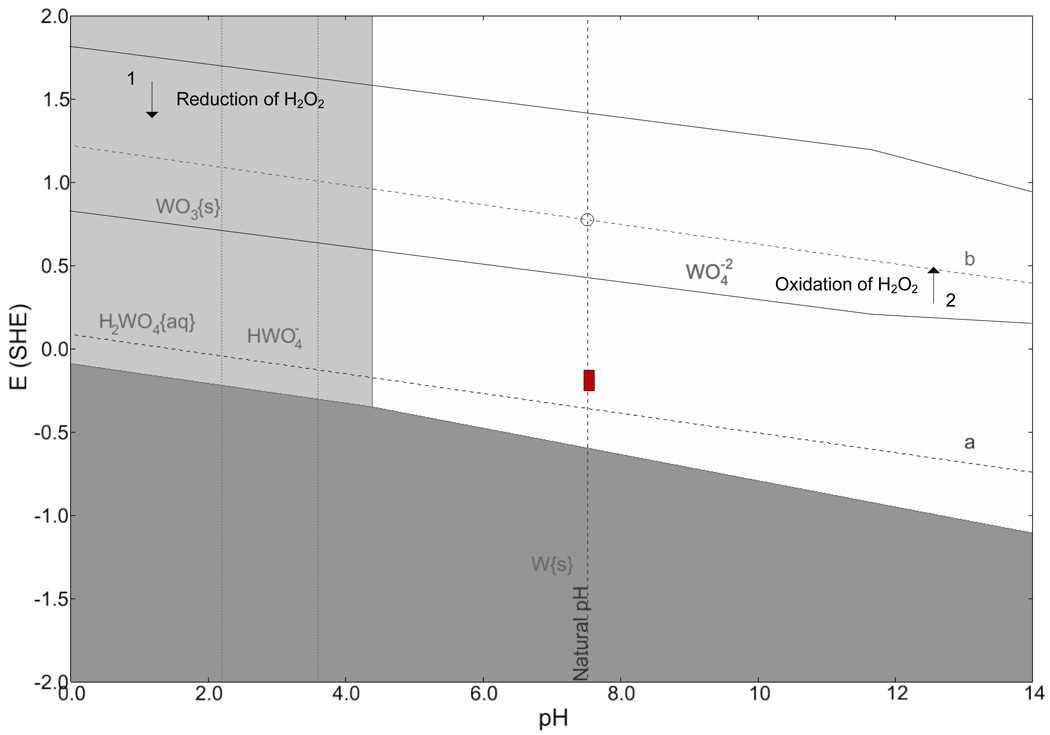
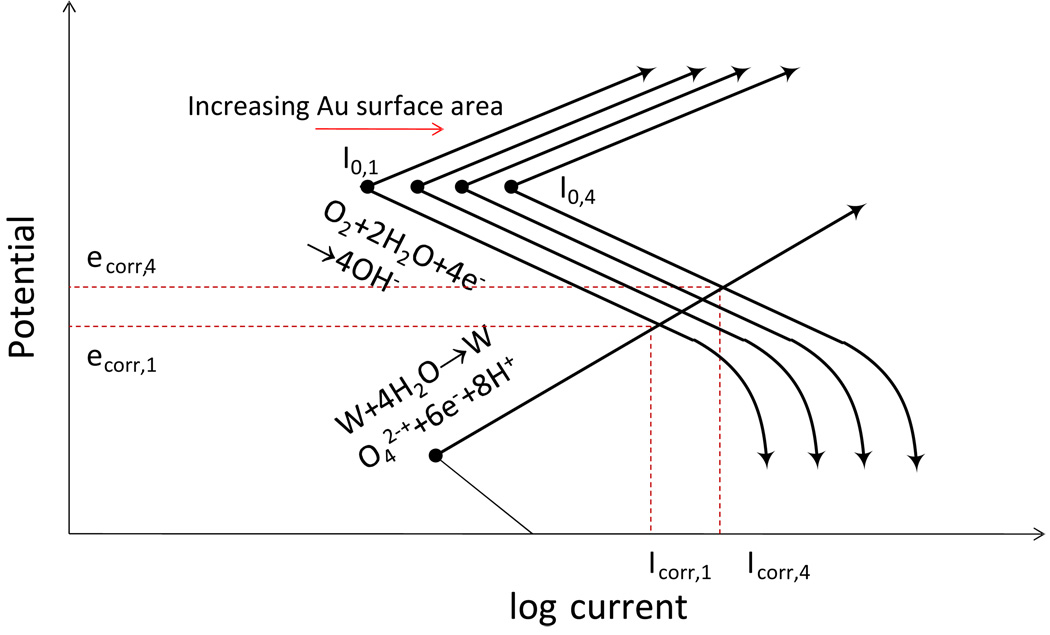
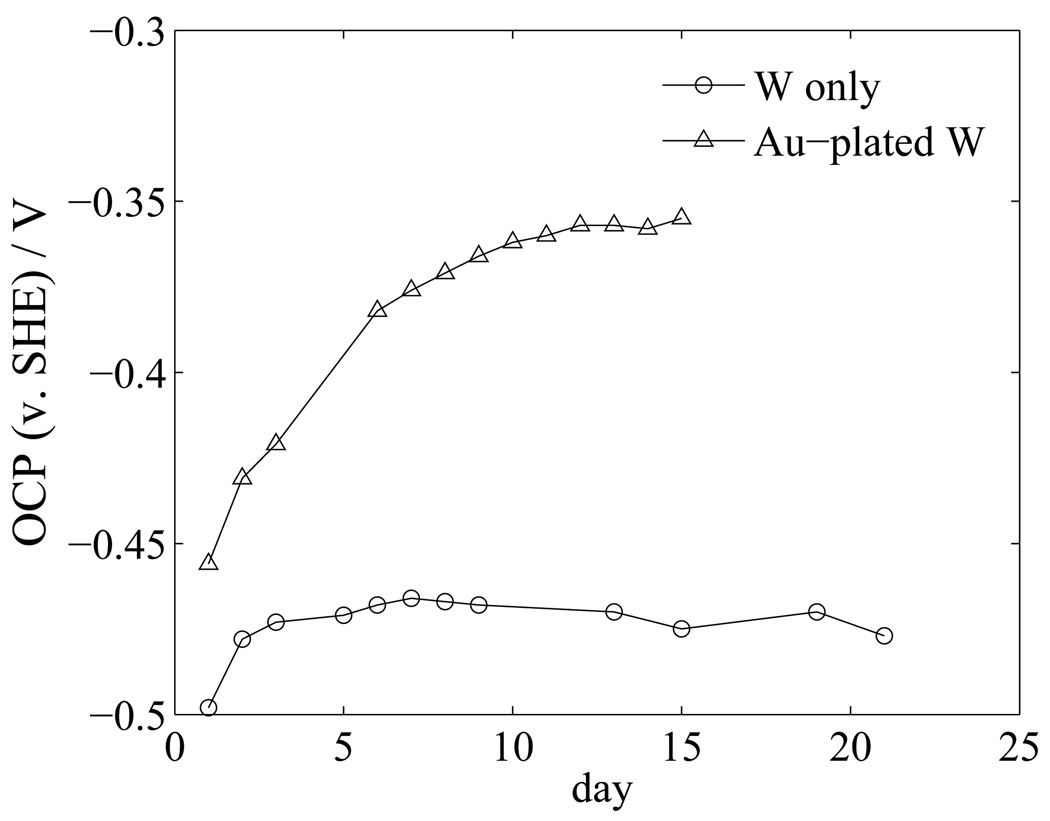
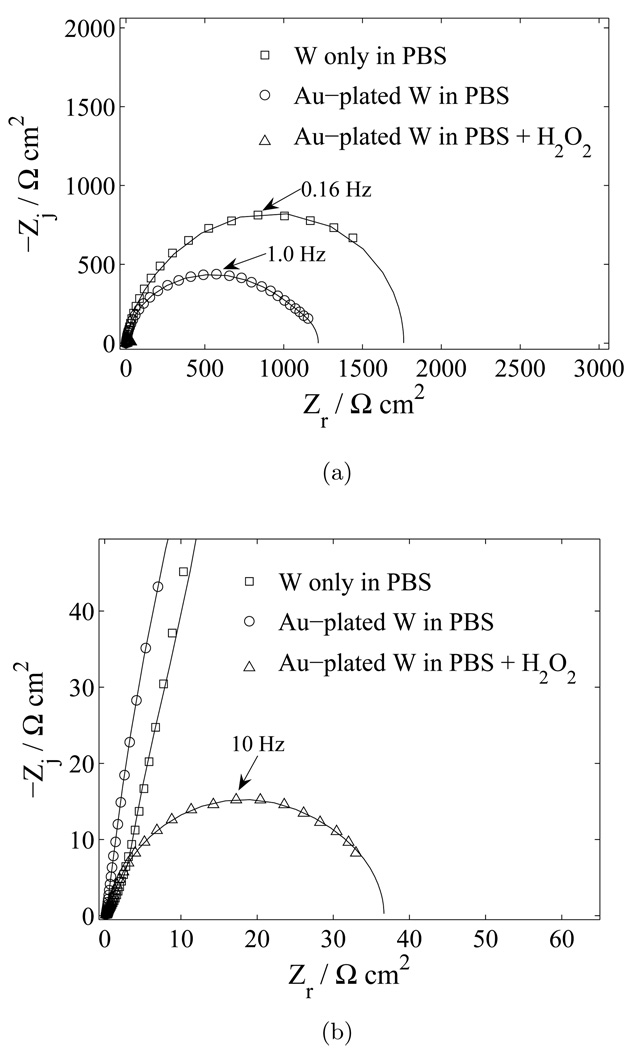
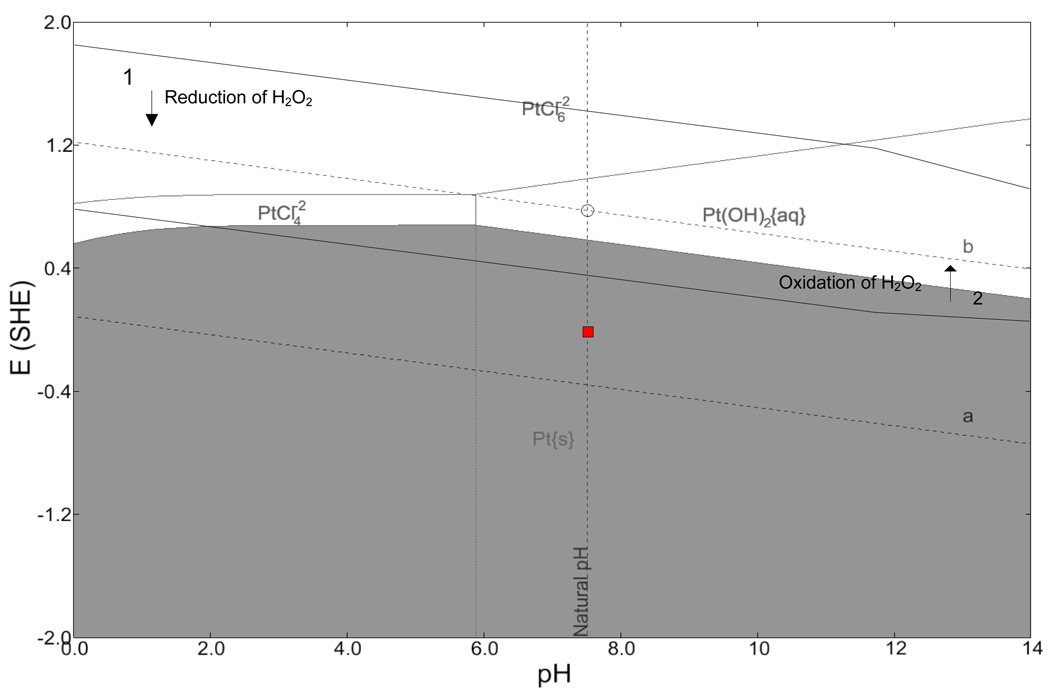
In neuroprosthetic applications, long-term electrode viability is necessary for robust recording of the activity of neural populations used for generating communication and control signals. The corrosion of tungsten microwire electrodes used for intracortical recording applications was analyzed in a controlled bench-top study and compared to the corrosion of tungsten microwires used in an in vivo study. Two electrolytes were investigated for the bench-top electrochemical analysis: 0.9% phosphate buffered saline (PBS) and 0.9% PBS containing 30 mM of hydrogen peroxide. The oxidation and reduction reactions responsible for corrosion were found by measurement of the open circuit potential and analysis of Pourbaix diagrams. Dissolution of tungsten to form the tungstic ion was found to be the corrosion mechanism. The corrosion rate was estimated from the polarization resistance, which was extrapolated from the electrochemical impedance spectroscopy data. The results show that tungsten microwires in an electrolyte of PBS have a corrosion rate of 300-700 μm/yr. The corrosion rate for tungsten microwires in an electrolyte containing PBS and 30 mM H₂O₂ is accelerated to 10,000-20,000 μm/yr. The corrosion rate was found to be controlled by the concentration of the reacting species in the cathodic reaction (e.g. O₂ and H₂O₂). The in vivo corrosion rate, averaged over the duration of implantation, was estimated to be 100 μm/yr. The reduced in vivo corrosion rate as compared to the bench-top rate is attributed to decreased rate of oxygen diffusion caused by the presence of a biological film and a reduced concentration of available oxygen in the brain.


Figures

Figure 1
Figure 1
Impedance response in PBS with electrode material as a parameter: a) real part of the impedance as a function of frequency; (b) imaginary part of the impedance as a function of frequency; and c) complex impedance plane (Nyquist) plot.
Figure 2
Figure 2
Equivalent circuits for blocking and reactive electrochemical systems (see, e.g., Orazem and Tribollet (2008)).
Figure 3
Figure 3
Impedance response of a platinum electrode in PBS with elapsed time as a parameter: a) imaginary part of the impedance as a function of frequency; and b) complex impedance plane (Nyquist) plot.
Figure 4
Figure 4
Impedance response of gold-plated tungsten electrodes in PBS over a 15 day period with elapsed time as a parameter: (a imaginary part of the impedance as a function of frequency; and b) complex impedance plane (Nyquist) plot.
Figure 5
Figure 5
Impedance response of a tungsten electrode in PBS with O2 content as a parameter: a) imaginary part of the impedance as a function of frequency; and b) complex impedance plane (Nyquist) plot.
Figure 6
Figure 6
Impedance response in an electrolyte containing PBS and H2O2 with electrode material as a parameter: a) imaginary part of the impedance as a function of frequency; and b) complex impedance plane (Nyquist) plot.
Figure 7
Figure 7
Optical photographs of a tungsten electrode (a) before and (b) after immersion in PBS for 23 days. The nominal diameter of the electrode is 50 µm.
Figure 8
Figure 8
Optical photographs of gold-plated tungsten electrodes (a) before and after immersion in PBS for (b) one day, (c) two days, (d) three days, (e) four days,(f) five days, (g) and six days. The nominal diameter of each electrode is 50 µm.
Figure 9
Figure 9
Optical photographs of a gold-plated tungsten electrodes (a) before and after immersion in an electrolyte containing PBS and 30 mM H2O2 for (b) one hour, (c) two hours, (d) three hours, and (e) 23 hours. The nominal diameter of the electrode is 50 µm.
Figure 10
Figure 10
Optical photographs of a platinum electrode (a) before and (b) after immersion in PBS for 14 days. The nominal diameter of the electrode is 50 µm.
Figure 11
Figure 11
SEM images of tungsten micro-wires: a) and b) typical electrodes before implantation; and c) typical electrodes after implantation in vivo for 87 days (Patrick et al., 2010). The inset in (c) highlights the area of gold exposed to the tissue. The scale bar in (a) and (c) is 100 µm. The scale bar in (b) is 50 µm.
Figure 12
Figure 12
EDS results for two sites on one electrode after implantation in vivo for 87 days. The results are characteristic of a bare tungsten and gold surface (top graph) and of a bio-film (bottom graph). The scale bar in the photograph is 50 µm.
Figure 13
Figure 13
Pourbaix diagram for tungsten in PBS. The box shows range of open circuit potential measured over a period of 15 days. The diagrams were generated by CorrosionAnalyzer 1.3 Revision 1.3.33 by OLI Systems Inc.
Figure 14
Figure 14
Pourbaix diagram for tungsten in an electrolyte containing PBS and 30 mM H2O2. The box shows the measured range of the open-circuit potential over a period of 2 days. The diagrams were generated by CorrosionAnalyzer 1.3 Revision 1.3.33 by OLI Systems Inc.
Figure 15
Figure 15
Hypothetical Evans diagram for the gold-plated tungsten electrode showing the effect of increased cathode surface area on the galvanic interaction of tungsten and gold.
Figure 16
Figure 16
Open-circuit potential as a function of elapsed time for gold-plated tungsten and tungsten electrodes in PBS electrolyte.
Figure 17
Figure 17
Estimation of polarization resistance, Rp, for three tungsten systems. The lines represent the results of regression of a Voigt model, equation (9) to the data. A) complex impedance plane (Nyquist) plot with electrode material and electrolyte as a parameter; and b) enlarged section of (a) emphasizing the results for gold-plated tungsten in PBS with added H2O2.
Figure 18
Figure 18
Pourbaix diagram for platinum in PBS with 30 mM hydrogen peroxide. The red box shows range of measured open circuit potential. The diagrams were generated by CorrosionAnalyzer 1.3 Revision 1.3.33 by OLI Systems Inc.
Figure 19
Figure 19
Cyclic voltammogram for a platinum electrode in an electrolyte containing PBS and 30 mM H2O2.

References

    1. Anik M. ph-dependent anodic reaction behavior of tungsten in acidic phosphate solutions. Electrochimica Acta. 2009;54(15):3943–3951.
    1. Anik M, Osseo-Asare K. Effect of ph on the anodic behavior of tungsten. Journal of The Electrochemical Society. 2002;149(6):B224–B233.
    1. Benson BB, Krause D., Jr. The concentration and isotopic fractionation of oxygen dissolved in freshwater and seawater in equilibrium with the atmosphere. Limnology and Oceanography. 1984;29:620–632.
    1. Bothra S, Sur H, Liang V. A new failure mechanism by corrosion of tungsten in a tungsten plug process. Microelectronics and Reliability. 1999;39(1):59–68.
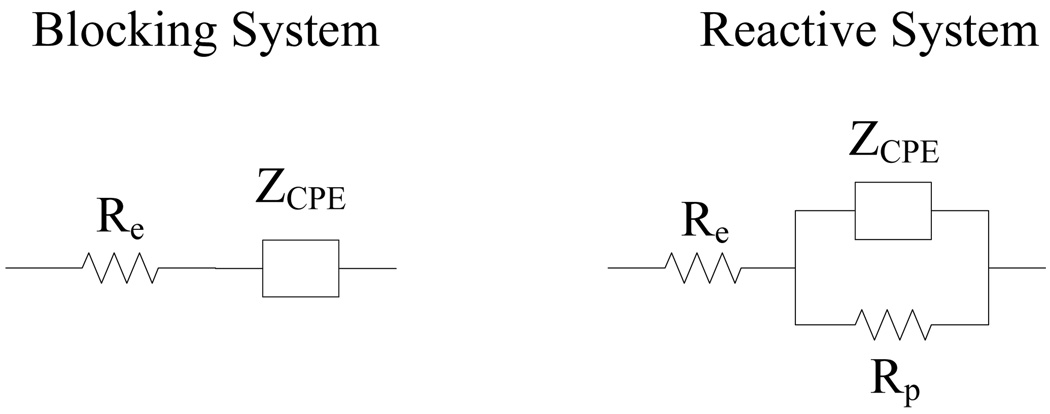
    1. Brug G, den Eeden AV, Sluyters-Rehbach M, Sluyters J. The analysis of electrode impedances complicated by the presence of a constant phase element. Electroanal Chem. 1984;176:275–295.

Publication types

LinkOut - more resources