

Plasmodium falciparum resistance to cytocidal versus cytostatic effects of chloroquine
- PMID: 21470564
- PMCID: PMC3101316
- DOI: 10.1016/j.molbiopara.2011.03.003
Plasmodium falciparum resistance to cytocidal versus cytostatic effects of chloroquine
Abstract
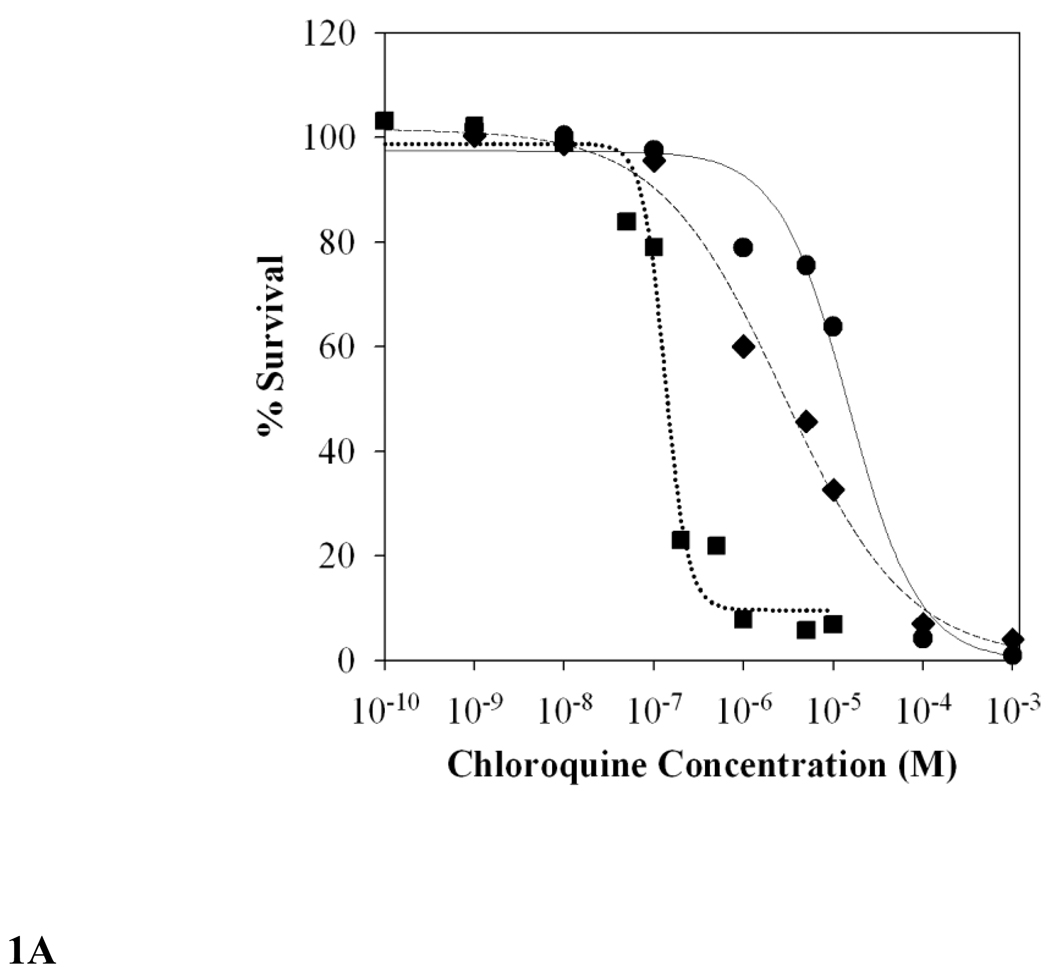
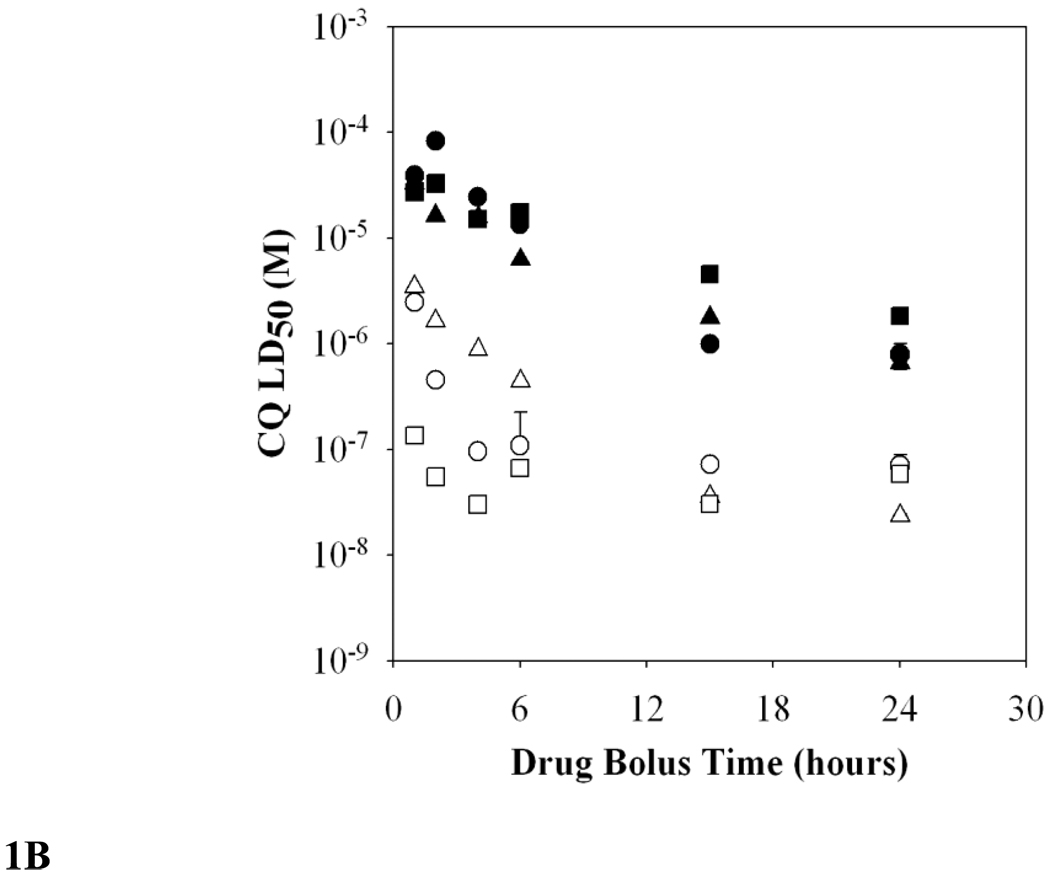
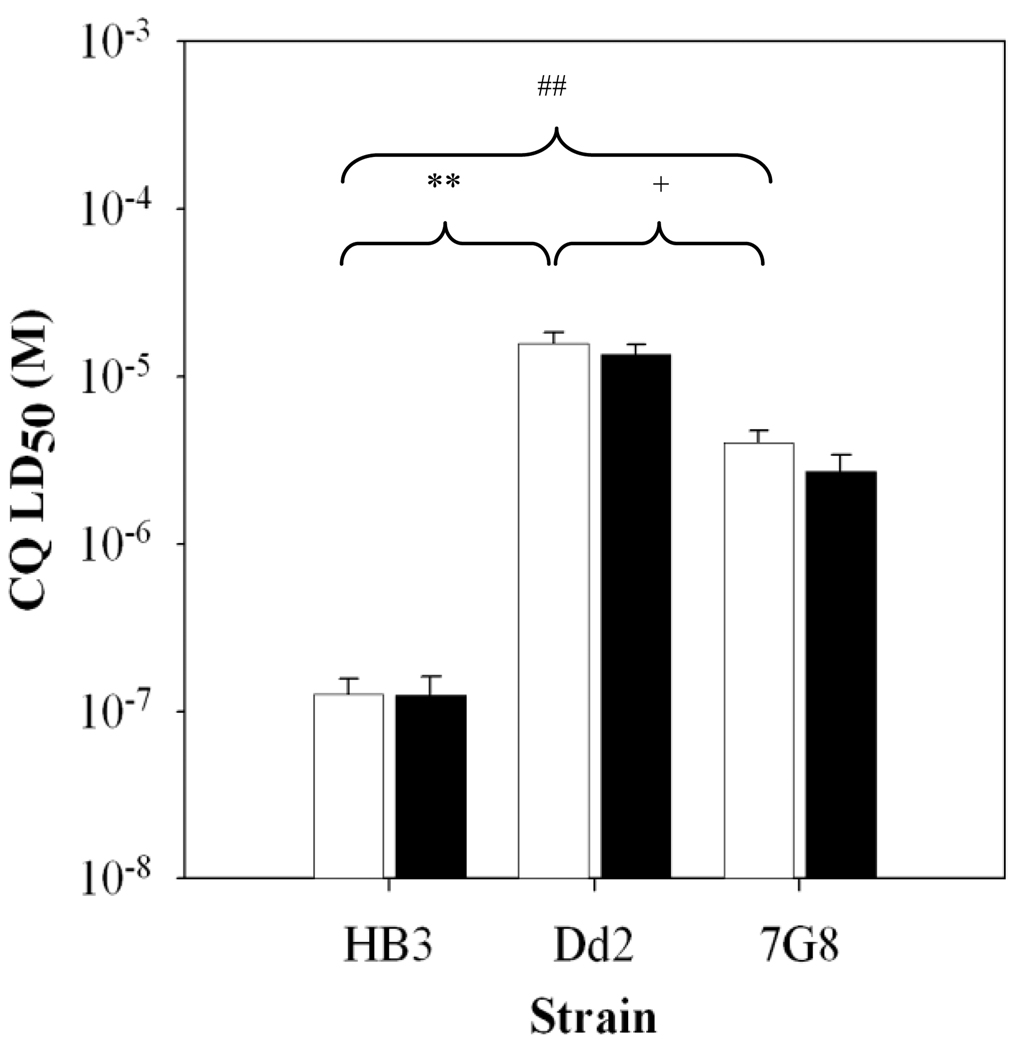
With one exception (Gligorijevic et al., Mol Biochem Parasitol 2008;159:7-23.) all previous quantification of chloroquine (CQ) potency vs. P. falciparum has been by growth inhibition assays, meaning potency is defined as cytostatic potential and quantified by IC(50) values. In this study we investigate the cytocidal potency of CQ and other common quinoline antimalarial drugs (quantified as LD(50)). Similar to results from assays for cytostatic potency, we are able to readily distinguish drug resistant from drug sensitive P. falciparum parasites as well as different degrees of resistance. However, we find that fold-resistance to CQ and other quinoline drugs quantified via LD(50) ratios differs quite dramatically from fold resistance calculated via IC(50) ratios. Also, importantly, we find that verapamil chemoreversal of CQ resistance differs when quantified via cytocidal vs. cytostatic assays, as do patterns of "multidrug" resistance in well-known laboratory strains of P. falciparum. The results have important implications for development of new antimalarial drugs and for fully defining the genetic loci that confer clinically relevant antimalarial drug resistance phenomena.
Copyright © 2011 Elsevier B.V. All rights reserved.
Figures
Similar articles
-
A process similar to autophagy is associated with cytocidal chloroquine resistance in Plasmodium falciparum.PLoS One. 2013 Nov 20;8(11):e79059. doi: 10.1371/journal.pone.0079059. eCollection 2013. PLoS One. 2013. PMID: 24278114 Free PMC article.
-
Reduced digestive vacuolar accumulation of chloroquine is not linked to resistance to chloroquine toxicity.Biochemistry. 2009 Dec 1;48(47):11152-4. doi: 10.1021/bi901765v. Biochemistry. 2009. PMID: 19883122 Free PMC article.
-
Roxithromycin potentiates the effects of chloroquine and mefloquine on multidrug-resistant Plasmodium falciparum in vitro.Exp Parasitol. 2007 Apr;115(4):387-92. doi: 10.1016/j.exppara.2006.10.004. Epub 2006 Nov 21. Exp Parasitol. 2007. PMID: 17118354
-
Relative to quinine and quinidine, their 9-epimers exhibit decreased cytostatic activity and altered heme binding but similar cytocidal activity versus Plasmodium falciparum.Antimicrob Agents Chemother. 2013 Jan;57(1):365-74. doi: 10.1128/AAC.01234-12. Epub 2012 Oct 31. Antimicrob Agents Chemother. 2013. PMID: 23114754 Free PMC article.
-
Current understanding of the molecular basis of chloroquine-resistance in Plasmodium falciparum.J Postgrad Med. 2006 Oct-Dec;52(4):271-6. J Postgrad Med. 2006. PMID: 17102545 Review.
Cited by
-
A process similar to autophagy is associated with cytocidal chloroquine resistance in Plasmodium falciparum.PLoS One. 2013 Nov 20;8(11):e79059. doi: 10.1371/journal.pone.0079059. eCollection 2013. PLoS One. 2013. PMID: 24278114 Free PMC article.
-
To kill or not to kill, that is the question: cytocidal antimalarial drug resistance.Trends Parasitol. 2014 Mar;30(3):130-5. doi: 10.1016/j.pt.2014.01.004. Epub 2014 Feb 13. Trends Parasitol. 2014. PMID: 24530127 Free PMC article.
-
High-throughput matrix screening identifies synergistic and antagonistic antimalarial drug combinations.Sci Rep. 2015 Sep 25;5:13891. doi: 10.1038/srep13891. Sci Rep. 2015. PMID: 26403635 Free PMC article.
-
Altered temporal response of malaria parasites determines differential sensitivity to artemisinin.Proc Natl Acad Sci U S A. 2013 Mar 26;110(13):5157-62. doi: 10.1073/pnas.1217452110. Epub 2013 Feb 19. Proc Natl Acad Sci U S A. 2013. PMID: 23431146 Free PMC article.
-
Biological Studies and Target Engagement of the 2- C-Methyl-d-Erythritol 4-Phosphate Cytidylyltransferase (IspD)-Targeting Antimalarial Agent (1 R,3 S)-MMV008138 and Analogs.ACS Infect Dis. 2018 Apr 13;4(4):549-559. doi: 10.1021/acsinfecdis.7b00159. Epub 2017 Nov 7. ACS Infect Dis. 2018. PMID: 29072835 Free PMC article.
References
-
- Ferdig MT, Cooper RA, Mu J, Deng B, Joy DA, Su XZ, Wellems TE. Dissecting the loci of low-level quinine resistance in malaria parasites. Mol Microbiol. 2004;52:985–997. - PubMed
-
- Fidock DA, Nomura T, Talley AK, Cooper RA, Dzekunov SM, Ferdig MT, Ursos LM, Sidhu AB, Naudé B, Deitsch KW, Su XZ, Wootton JC, Roepe PD, Wellems TE. Mutations in the P. falciparum digestive vacuole transmembrane protein PfCRT and evidence for their role in chloroquine resistance. Mol Cell. 2000;6:861–871. - PMC - PubMed
-
- Ndiaye D, Patel V, Demas A, LeRoux M, Ndir O, Mboup S, Clardy J, Lakshmanan V, Daily JP, Wirth DF. A non-radioactive DAPI-based high-throughput in vitro assay to assess Plasmodium falciparum responsiveness to antimalarials--increased sensitivity of P. falciparum to chloroquine in Senegal. Am J Trop Med Hyg. 2010;82:228–230. - PMC - PubMed
Publication types
MeSH terms
Substances
Grants and funding
LinkOut - more resources
Full Text Sources
Research Materials
