. 2011 Jun 17;286(24):21742-54.
doi: 10.1074/jbc.M110.160697. Epub 2011 Apr 6.

Mitochondrial dysfunction and oxidative stress contribute to the pathogenesis of spinocerebellar ataxia type 12 (SCA12)

Affiliations

Mitochondrial dysfunction and oxidative stress contribute to the pathogenesis of spinocerebellar ataxia type 12 (SCA12)

Yu-Chun Wang et al. J Biol Chem. .

Abstract

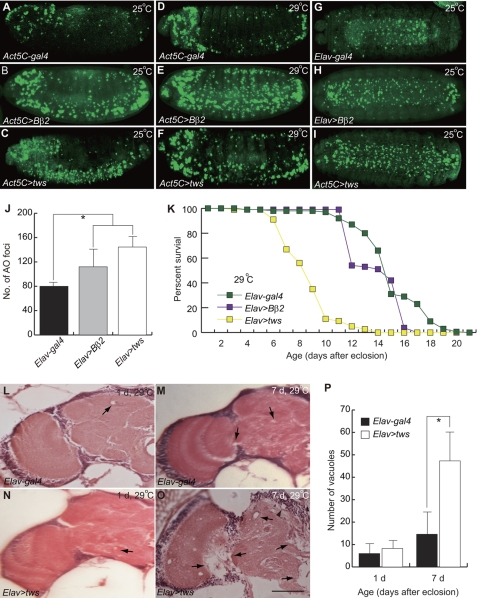
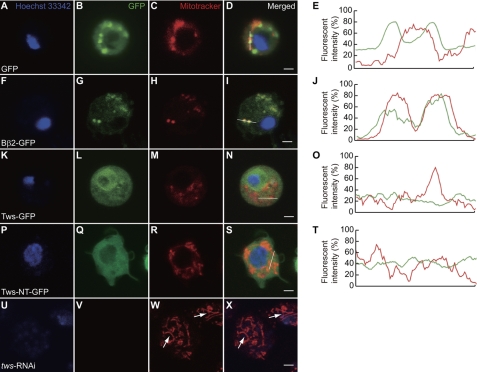
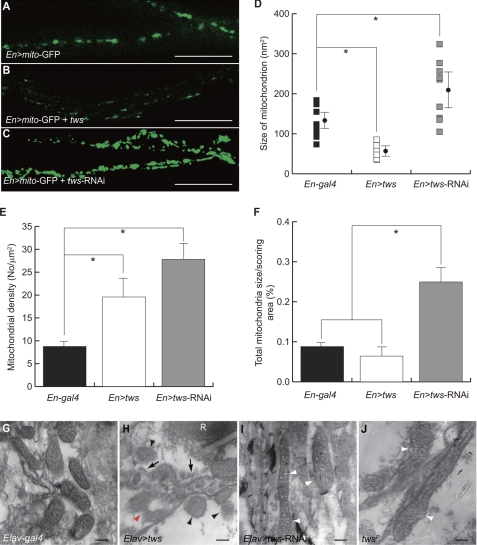
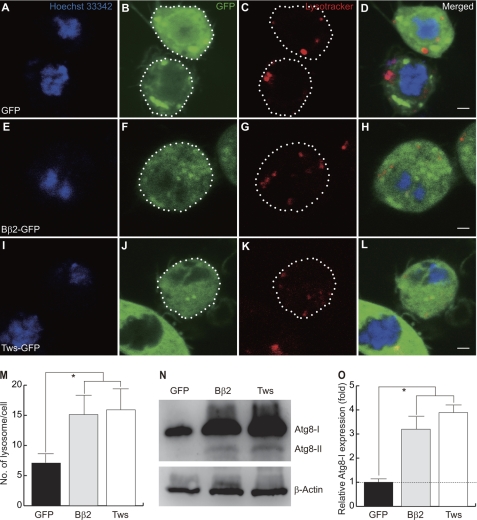
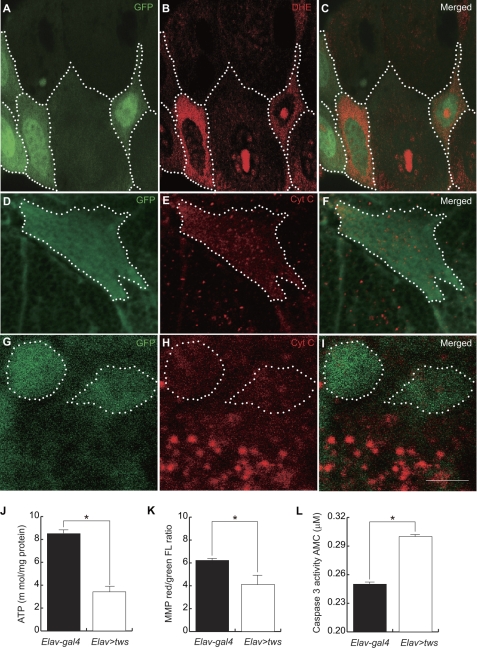
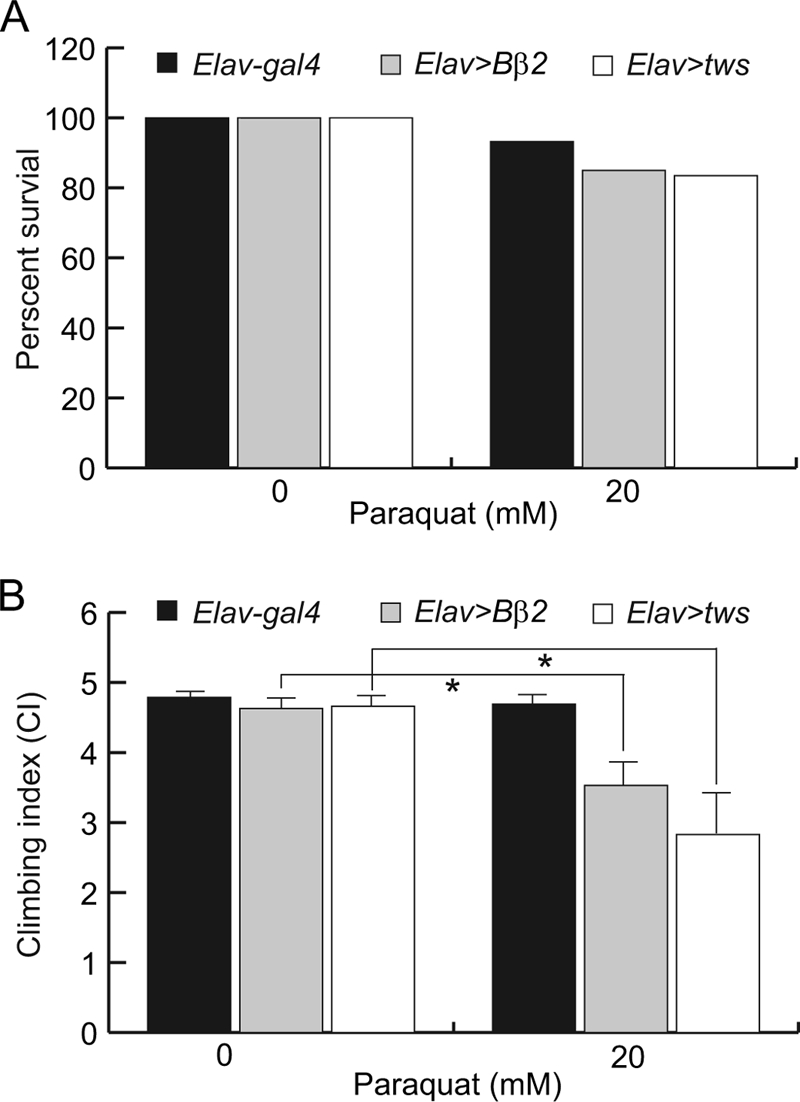
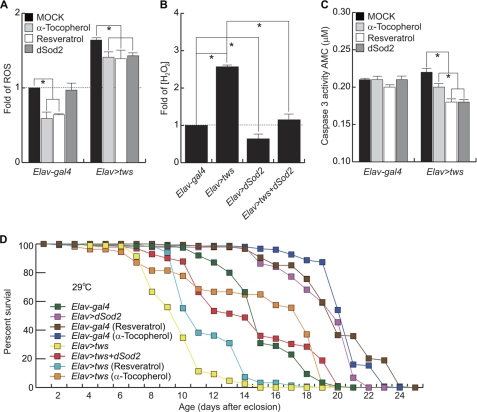
Spinal cerebellar ataxia type 12 (SCA12) has been attributed to the elevated expression of ppp2r2b. To better elucidate the pathomechanism of the neuronal disorder and to search for a pharmacological treatment, Drosophila models of SCA12 were generated by overexpression of a human ppp2r2b and its Drosophila homolog tws. Ectopic expression of ppp2r2b or tws caused various pathological features, including neurodegeneration, apoptosis, and shortened life span. More detailed analysis revealed that elevated ppp2r2b and tws induced fission of mitochondria accompanied by increases in cytosolic reactive oxygen species (ROS), cytochrome c, and caspase 3 activity. Transmission electron microscopy revealed that fragmented mitochondria with disrupted cristae were engulfed by autophagosomes in photoreceptor neurons of flies overexpressing tws. Additionally, transgenic flies were more susceptible to oxidative injury induced by paraquat. By contrast, ectopic Drosophila Sod2 expression and antioxidant treatment reduced ROS and caspase 3 activity and extended the life span of the SCA12 fly model. In summary, our study demonstrates that oxidative stress induced by mitochondrial dysfunction plays a causal role in SCA12, and reduction of ROS is a potential therapeutic intervention for this neuropathy.


Figures

FIGURE 1.
FIGURE 1.
Ectopic Tws caused neuropathies. Transgenic construct was constitutively overexpressed with the Act5C-gal4 or Elav-gal4 driver, and apoptotic cells were revealed by AO staining. Transgenic constructs were expressed at 25 °C (A–C and G–I) or 29 °C (D–F). A, control Act5C-gal4 driver flies exhibited normal programmed cell death patterns. B and C, expression of Bβ2 or tws induced cell death, particularly in the ventral cord of embryos. D, cell death was increased slightly in the control Act5C-gal4 driver at 29 °C. E and F, increased AO-positive cells were presented in Act5C>Bβ2 or Act5C>tws embryos. G, normal programmed cell death in the ventral cord of Elav-gal4 flies (ventral view). H and I, neuronal overexpression of Bβ2 or Tws affects viability of neuronal cells in the ventral cord of embryos (ventral view). J, number of dead cells in Elav-gal4 control (black bar), Elav>Bβ2 (gray bar), and Elav>tws (open bar) embryos. Data were expressed as mean ± S.D. values (n = 15) and were analyzed by one-way analysis of variance with supplementary Student-Newman-Kewls (SNK) test. * indicates p < 0.001. K, Tws severely reduces the life span of transgenic flies overexpressing tws at 29 °C. The life span of transgenic flies expressing Bβ2 was also significantly shorter than the control Elav-gal4 (Log-rank test, p = 0.00255). L–O, frontal brain sections of flies were revealed by H&E staining. L and N, neurodegeneration was detected slightly in 1-day-old control Elav-gal4 and Elav>tws flies raised at 29 °C. M, mild vacuolar degeneration was observed in the neuropil (arrow) of 7-day-old Elav-gal4 flies. O, larger and more vacuoles were present in the cortex (arrowhead) and the neuropil (arrow) of aged tws transgenic flies. P, neurodegeneration was assessed by quantification of vacuoles in the brain of flies raised at 29 °C. Number of vacuoles in Elav-gal4 control (black bar) and Elav>tws (open bar) is shown. d, day. Data were expressed as mean ± S.D. values and were analyzed by Student's t test; * indicates p < 0.01. Scale bar, 20 μm.
FIGURE 2.
FIGURE 2.
Subcellular localization of Tws. A–D, control S2 cells expressing GFP showed normal mitochondria. Expression constructs are as follows: F–I, Bβ2-GFP; K–N, Tws-GFP; P–S, Tws-NT-GFP; G–I, Bβ2 localizes to mitochondria. M, Tws induces significant mitochondrial fission. L–N, Tws did not co-localize with MitoTracker. Q–S, Tws does not possess a mitochondrial localization signal. E, J, O, and T, confocal laser scanning histograms of GFP (green) and MitoTracker (red) intensity profile for verification of colocalization. U–X, knocking down the expression of tws using RNAi (tws-RNAi) causes mitochondrial fusion. W and X, tubular mitochondria in S2 cells transfected with dsRNA corresponding to tws (white arrows). GFP, Bβ2-GFP and Tws-GFP (green). Nucleus (Hoechst 33342), blue; mitochondrion (MitoTracker), red. Scale bar, 4 μm.
FIGURE 3.
FIGURE 3.
Tws affects the morphogenesis of mitochondria in CNS. A, mitochondria in the axons of ventral ganglia were labeled with mito-GFP driven by En-gal4. B, fragmentation of mitochondria in En>tws flies. C, fusion of mitochondria in En>tws-RNAi flies. Scale bar, 20 μm. D–F, Tws regulates the size, density, and biogenesis of mitochondria. Statistical analyses were performed using one-way analysis of variance with supplementary Student-Newman-Kewls test and are expressed as mean ± S.D.; * indicates p < 0.001. G–I, ultrastructure of mitochondria in the transverse sections of adult retina was accessed by transmission electron microscopy. Normal mitochondria in Elav-gal4. H, ectopic Tws caused scission of mitochondria (red arrowhead). Many disintegrated mitochondria with less condensed cristae were present (black arrowheads), and some were circled by autophagosome-like organelles (arrows). I and J, tubular mitochondria with swollen cristae were present in Elav>tws-RNAi or tws mutant (twsp flies (white arrowheads). R = rhabdomere. Scale bar, 200 nm.
FIGURE 4.
FIGURE 4.
Tws induces autophagic response. Expression constructs are as follows: A–D, GFP; E–H, Bβ2-GFP; I–L, Tws-GFP. Note that ectopic expression of Bβ2 or Tws induced the formation of lysosomes. The outline of transfected S2 cells are marked (green with dotted line). Nucleus (Hoechst 33342), blue; lysosome (LysoTracker), red. Scale bar, 4 μm. M, numbers of lysosomes in S2 cells transfected with GFP (black bar), Bβ2 (gray bar), and Tws (open bar) were compared. Data were expressed as mean ± S.D. values and analyzed by one-way analysis of variance with supplementary Student-Newman-Kewls test. * indicates p < 0.001. N, representative immunoblot showed that Atg-I (∼16 kDa) was presented in the heads of flies. However, a smaller form of Atg8-II (∼14 kDa) was induced only in flies expressing Bβ2 or Tws. Loading control, β-actin. O, quantitative Western blotting analysis of the relative expression levels of Atg8-I. The expression levels were normalized to the β-actin control. Data were expressed as mean ± S.D. values and analyzed by Student's t test; * indicates p < 0.01 (n = 4).
FIGURE 5.
FIGURE 5.
Ectopic Tws disrupted mitochondrial function. A, D, and G, expressed clones in salivary gland and neuroblast were marked by GFP (green with dotted line). B, ROS was labeled with dihydroethidium (DHE, red). C, merged view of A and B. E and H, cytochrome c (red). F, merged view of D and E. I, merged view of G and H. J–L, ATP levels, MMP, and caspase 3 activity in the heads of 30-day-old flies with Elav-gal4 (black bar) and Elav>tws (open bar) were compared. Data are expressed as mean ± S.D. values and analyzed by Student's t test; * indicates p < 0.01.
FIGURE 6.
FIGURE 6.
Transgenic flies overexpressing Bβ2 or tws are more sensitive to oxidative injury. Newly eclosed Elav-gal4 (black bar), Elav>Bβ2 (gray bar), and Elav>tws (open bar) flies were exposed to drug-free or to 20 mm paraquat at 29 °C. A, survivorship was scored after 60 h. Compared with no drug treatment, administration of 20 mm paraquat reduced the survival of control Elav-gal4 by 6.8% and the survival of Bβ2 and tws transgenic flies was reduced by 16.5 and 15%, respectively. B, mobility assay was performed after 48 h. The mobility of control Elav-gal4 flies was not severely impaired in the presence of paraquat, but the climbing index was significantly lowered when Bβ2 or tws transgenic flies were challenged with paraquat. Data were expressed as mean ± S.D. values and analyzed by Student's t test; * indicates p < 0.01.
FIGURE 7.
FIGURE 7.
Reduction of ROS is beneficial in the SCA12 fly model. A–C, administration of antioxidants or expression of dSOD2 reduced ROS levels, concentration of hydrogen peroxide, and caspase 3 activity in heads of transgenic flies overexpressing Tws. The relative ROS level and concentration of hydrogen peroxide were normalized to that of the control Elav-gal4 driver animals. Data were expressed as the mean ± S.D. values and quantified using one-way analysis of variance followed by Student-Newman-Kewls post hoc test; * indicates p < 0.01. D, antioxidants significantly extended the life span of control and tws-expressing flies.

References

    1. Dueñas A. M., Goold R., Giunti P. (2006) Brain 129, 1357–1370 - PubMed
    1. Manto M., Marmolino D. (2009) Curr. Opin. Neurol. 22, 419–429 - PubMed
    1. Trujillo-Martín M. M., Serrano-Aguilar P., Monton-Alvarez F., Carrillo-Fumero R. (2009) Mov. Disord. 24, 1111–1124 - PubMed
    1. Holmes S. E., Hearn E. O., Ross C. A., Margolis R. L. (2001) Brain Res. Bull. 56, 397–403 - PubMed
    1. Holmes S. E., O'Hearn E., Margolis R. L. (2003) Cytogenet. Genome Res. 100, 189–197 - PubMed

Publication types

LinkOut - more resources