. 2011 Jun;259(3):834-43.
doi: 10.1148/radiol.11101975. Epub 2011 Apr 6.

Mild cognitive impairment: baseline and longitudinal structural MR imaging measures improve predictive prognosis

Collaborators, Affiliations

Mild cognitive impairment: baseline and longitudinal structural MR imaging measures improve predictive prognosis

Linda K McEvoy et al. Radiology. 2011 Jun.

Abstract

Purpose: To assess whether single-time-point and longitudinal volumetric magnetic resonance (MR) imaging measures provide predictive prognostic information in patients with amnestic mild cognitive impairment (MCI).

Materials and methods: This study was conducted with institutional review board approval and in compliance with HIPAA regulations. Written informed consent was obtained from all participants or the participants' legal guardians. Cross-validated discriminant analyses of MR imaging measures were performed to differentiate 164 Alzheimer disease (AD) cases from 203 healthy control cases. Separate analyses were performed by using data from MR images obtained at one time point or by combining single-time-point measures with 1-year change measures. Resulting discriminant functions were applied to 317 MCI cases to derive individual patient risk scores. Risk of conversion to AD was estimated as a continuous function of risk score percentile. Kaplan-Meier survival curves were computed for risk score quartiles. Odds ratios (ORs) for the conversion to AD were computed between the highest and lowest quartile scores.

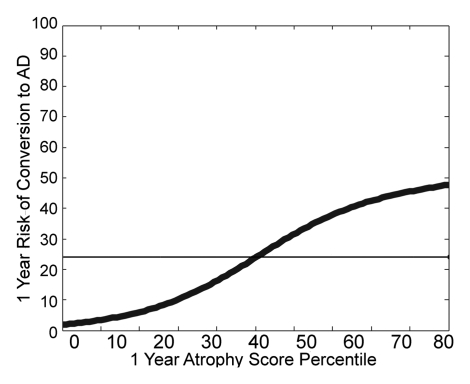
Results: Individualized risk estimates from baseline MR examinations indicated that the 1-year risk of conversion to AD ranged from 3% to 40% (average group risk, 17%; OR, 7.2 for highest vs lowest score quartiles). Including measures of 1-year change in global and regional volumes significantly improved risk estimates (P = 001), with the risk of conversion to AD in the subsequent year ranging from 3% to 69% (average group risk, 27%; OR, 12.0 for highest vs lowest score quartiles).

Conclusion: Relative to the risk of conversion to AD conferred by the clinical diagnosis of MCI alone, MR imaging measures yield substantially more informative patient-specific risk estimates. Such predictive prognostic information will be critical if disease-modifying therapies become available.

Supplemental material: http://radiology.rsna.org/lookup/suppl/doi:10.1148/radiol.11101975/-/DC1.


Figures

Figure 1:
Figure 1:
Regions examined in QDA are outlined (in white) on medial (left) and lateral (middle) views of reconstructed parcellated left-hemisphere cortical surface and on segmented coronal view (right) of brain. Average thickness or volume across left- and right-hemisphere regions was used. Examined regions included isthmus cingulate, entorhinal cortex, medial and lateral orbitofrontal cortices, superior and middle temporal gyri, bank of superior temporal sulcus (not visible), and hippocampus. These regions were chosen on the basis of their utility for discrimination of AD data from healthy control subject data in a prior study involving a subset of the subjects with AD and healthy control subjects evaluated in the current study (211 [57.5%] of 367 subjects) (28). Whole-brain and inferior lateral ventricle volumes (not shown) also were included in the analysis.
Figure 2a:
Figure 2a:
Spaghetti plots illustrate volumes (as percentages of estimated total intracranial volume [eTIV]) and volume changes across all evaluatable follow-up visits as functions of age for (a) whole brain, (b) inferior lateral ventricle, and (c) hippocampus. (d) For entorhinal cortex, thicknesses and changes in thickness are shown. Healthy control subject data are in dark blue; AD data are in red. Data from the two healthy control subjects whose cognitive status changed to AD by the time of these analyses are in light blue. Although these individuals were excluded from the healthy control subject group before the analyses, their data are shown here as evidence of the sensitivity of these structural MR measures to AD atrophy in individuals in a clinically unrecognized prodromal AD state.
Figure 2b:
Figure 2b:
Spaghetti plots illustrate volumes (as percentages of estimated total intracranial volume [eTIV]) and volume changes across all evaluatable follow-up visits as functions of age for (a) whole brain, (b) inferior lateral ventricle, and (c) hippocampus. (d) For entorhinal cortex, thicknesses and changes in thickness are shown. Healthy control subject data are in dark blue; AD data are in red. Data from the two healthy control subjects whose cognitive status changed to AD by the time of these analyses are in light blue. Although these individuals were excluded from the healthy control subject group before the analyses, their data are shown here as evidence of the sensitivity of these structural MR measures to AD atrophy in individuals in a clinically unrecognized prodromal AD state.
Figure 2c:
Figure 2c:
Spaghetti plots illustrate volumes (as percentages of estimated total intracranial volume [eTIV]) and volume changes across all evaluatable follow-up visits as functions of age for (a) whole brain, (b) inferior lateral ventricle, and (c) hippocampus. (d) For entorhinal cortex, thicknesses and changes in thickness are shown. Healthy control subject data are in dark blue; AD data are in red. Data from the two healthy control subjects whose cognitive status changed to AD by the time of these analyses are in light blue. Although these individuals were excluded from the healthy control subject group before the analyses, their data are shown here as evidence of the sensitivity of these structural MR measures to AD atrophy in individuals in a clinically unrecognized prodromal AD state.
Figure 2d:
Figure 2d:
Spaghetti plots illustrate volumes (as percentages of estimated total intracranial volume [eTIV]) and volume changes across all evaluatable follow-up visits as functions of age for (a) whole brain, (b) inferior lateral ventricle, and (c) hippocampus. (d) For entorhinal cortex, thicknesses and changes in thickness are shown. Healthy control subject data are in dark blue; AD data are in red. Data from the two healthy control subjects whose cognitive status changed to AD by the time of these analyses are in light blue. Although these individuals were excluded from the healthy control subject group before the analyses, their data are shown here as evidence of the sensitivity of these structural MR measures to AD atrophy in individuals in a clinically unrecognized prodromal AD state.
Figure 3a:
Figure 3a:
Scatterplots of baseline measures versus annual percentage changes for (a) whole brain, (b) inferior lateral ventricle, (c) hippocampus, and (d) entorhinal cortex after effects of age and sex are regressed out. Dark blue dots represent healthy control subject data, and red dots represent AD data. Light blue circles represent data for two healthy control subjects whose cognitive status changed to AD. As evident from these data, the informative value of baseline and longitudinal change measures differs for different brain regions. For example, healthy control subjects and subjects with AD show substantial overlap in whole-brain and inferior ventricle volumes at baseline, but subjects with AD show larger annual percentage changes than do healthy control subjects. Greater group variance in baseline and longitudinal change measures are observed in entorhinal cortex and to a lesser extent in hippocampus. For all regions, baseline measures and percentage changes differ significantly between healthy control subject and AD groups (P < .001 for all comparisons). See Table E1 (online) for statistical comparisons.
Figure 3b:
Figure 3b:
Scatterplots of baseline measures versus annual percentage changes for (a) whole brain, (b) inferior lateral ventricle, (c) hippocampus, and (d) entorhinal cortex after effects of age and sex are regressed out. Dark blue dots represent healthy control subject data, and red dots represent AD data. Light blue circles represent data for two healthy control subjects whose cognitive status changed to AD. As evident from these data, the informative value of baseline and longitudinal change measures differs for different brain regions. For example, healthy control subjects and subjects with AD show substantial overlap in whole-brain and inferior ventricle volumes at baseline, but subjects with AD show larger annual percentage changes than do healthy control subjects. Greater group variance in baseline and longitudinal change measures are observed in entorhinal cortex and to a lesser extent in hippocampus. For all regions, baseline measures and percentage changes differ significantly between healthy control subject and AD groups (P < .001 for all comparisons). See Table E1 (online) for statistical comparisons.
Figure 3c:
Figure 3c:
Scatterplots of baseline measures versus annual percentage changes for (a) whole brain, (b) inferior lateral ventricle, (c) hippocampus, and (d) entorhinal cortex after effects of age and sex are regressed out. Dark blue dots represent healthy control subject data, and red dots represent AD data. Light blue circles represent data for two healthy control subjects whose cognitive status changed to AD. As evident from these data, the informative value of baseline and longitudinal change measures differs for different brain regions. For example, healthy control subjects and subjects with AD show substantial overlap in whole-brain and inferior ventricle volumes at baseline, but subjects with AD show larger annual percentage changes than do healthy control subjects. Greater group variance in baseline and longitudinal change measures are observed in entorhinal cortex and to a lesser extent in hippocampus. For all regions, baseline measures and percentage changes differ significantly between healthy control subject and AD groups (P < .001 for all comparisons). See Table E1 (online) for statistical comparisons.
Figure 3d:
Figure 3d:
Scatterplots of baseline measures versus annual percentage changes for (a) whole brain, (b) inferior lateral ventricle, (c) hippocampus, and (d) entorhinal cortex after effects of age and sex are regressed out. Dark blue dots represent healthy control subject data, and red dots represent AD data. Light blue circles represent data for two healthy control subjects whose cognitive status changed to AD. As evident from these data, the informative value of baseline and longitudinal change measures differs for different brain regions. For example, healthy control subjects and subjects with AD show substantial overlap in whole-brain and inferior ventricle volumes at baseline, but subjects with AD show larger annual percentage changes than do healthy control subjects. Greater group variance in baseline and longitudinal change measures are observed in entorhinal cortex and to a lesser extent in hippocampus. For all regions, baseline measures and percentage changes differ significantly between healthy control subject and AD groups (P < .001 for all comparisons). See Table E1 (online) for statistical comparisons.
Figure 4a:
Figure 4a:
(a) Kaplan-Meier survival curves of increasing atrophy score quartiles for patients with MCI. Probabilities of remaining free of AD as functions of time are shown for atrophy scores derived from baseline MR measures. Probabilities at 0–25th (1st quartile), 26th–50th (2nd quartile), 51st–75th (3rd quartile), and 76th–100th (4th quartile) percentiles are shown. Log rank statistics for each quartile versus next higher quartile are as follows: 1st versus 2nd quartile: χ2 = 5.16, P = .023; 2nd versus 3rd quartile: χ2 = 12.49, P < .001; and 3rd versus 4th quartile: χ2 = 0.127, P = .72. (b) Thick curved line on graph illustrates risk of conversion to AD within 1 year as a continuous function of baseline atrophy score percentile, estimated by using binomial smoothing spline-fitting procedure. Straight horizontal line indicates average group risk (17%). A new patient’s atrophy score can be converted to a percentile score on the basis of the distribution of scores in the current study sample. The new individual’s risk estimate can then be read from this graph.
Figure 4b:
Figure 4b:
(a) Kaplan-Meier survival curves of increasing atrophy score quartiles for patients with MCI. Probabilities of remaining free of AD as functions of time are shown for atrophy scores derived from baseline MR measures. Probabilities at 0–25th (1st quartile), 26th–50th (2nd quartile), 51st–75th (3rd quartile), and 76th–100th (4th quartile) percentiles are shown. Log rank statistics for each quartile versus next higher quartile are as follows: 1st versus 2nd quartile: χ2 = 5.16, P = .023; 2nd versus 3rd quartile: χ2 = 12.49, P < .001; and 3rd versus 4th quartile: χ2 = 0.127, P = .72. (b) Thick curved line on graph illustrates risk of conversion to AD within 1 year as a continuous function of baseline atrophy score percentile, estimated by using binomial smoothing spline-fitting procedure. Straight horizontal line indicates average group risk (17%). A new patient’s atrophy score can be converted to a percentile score on the basis of the distribution of scores in the current study sample. The new individual’s risk estimate can then be read from this graph.
Figure 5a:
Figure 5a:
(a) Kaplan-Meier survival curves of increasing atrophy progression score quartiles for patients with MCI. Log rank statistics for each quartile versus next higher quartile are as follows: 1st versus 2nd quartile: χ2 = 1.26, P = .26; 2nd versus 3rd quartile: χ2 = 1.45, P = .23; and 3rd versus 4th quartile: χ2 = 13.13, P < .001. Probabilities of remaining free of AD as functions of time are shown for atrophy progression scores derived from baseline and 1-year follow-up MR measures. Survival analyses of only those MCI cases with no conversion to AD within the first year were performed. Probabilities at 0–25th (1st quartile), 26th–50th (2nd quartile), 51st–75th (3rd quartile), and 76th–100th (4th quartile) percentiles are shown. (b) Thick curved line on graph illustrates risk of conversion to AD within subsequent year as a continuous function of atrophy progression score percentile. (c) Thick curved line on graph illustrates risk of conversion to AD within subsequent year as a continuous function of atrophy score percentile, derived by using the 1-year MR imaging data as the baseline. Comparison of results in b and c illustrate the additional risk modification information provided by including rate-of-change measures. Atrophy measures from a single time point provide valuable risk information, enabling the identification of individuals at much lower (3%) and much higher (43%) risk of developing AD compared with average group risk of 27% (straight horizontal line in c). However, information derived from follow-up MR imaging enables even greater separation of risk, with the 1-year risk of conversion ranging from a risk similar to that of non–cognitive impaired elderly individuals (3%) to 69% (b).
Figure 5b:
Figure 5b:
(a) Kaplan-Meier survival curves of increasing atrophy progression score quartiles for patients with MCI. Log rank statistics for each quartile versus next higher quartile are as follows: 1st versus 2nd quartile: χ2 = 1.26, P = .26; 2nd versus 3rd quartile: χ2 = 1.45, P = .23; and 3rd versus 4th quartile: χ2 = 13.13, P < .001. Probabilities of remaining free of AD as functions of time are shown for atrophy progression scores derived from baseline and 1-year follow-up MR measures. Survival analyses of only those MCI cases with no conversion to AD within the first year were performed. Probabilities at 0–25th (1st quartile), 26th–50th (2nd quartile), 51st–75th (3rd quartile), and 76th–100th (4th quartile) percentiles are shown. (b) Thick curved line on graph illustrates risk of conversion to AD within subsequent year as a continuous function of atrophy progression score percentile. (c) Thick curved line on graph illustrates risk of conversion to AD within subsequent year as a continuous function of atrophy score percentile, derived by using the 1-year MR imaging data as the baseline. Comparison of results in b and c illustrate the additional risk modification information provided by including rate-of-change measures. Atrophy measures from a single time point provide valuable risk information, enabling the identification of individuals at much lower (3%) and much higher (43%) risk of developing AD compared with average group risk of 27% (straight horizontal line in c). However, information derived from follow-up MR imaging enables even greater separation of risk, with the 1-year risk of conversion ranging from a risk similar to that of non–cognitive impaired elderly individuals (3%) to 69% (b).
Figure 5c:
Figure 5c:
(a) Kaplan-Meier survival curves of increasing atrophy progression score quartiles for patients with MCI. Log rank statistics for each quartile versus next higher quartile are as follows: 1st versus 2nd quartile: χ2 = 1.26, P = .26; 2nd versus 3rd quartile: χ2 = 1.45, P = .23; and 3rd versus 4th quartile: χ2 = 13.13, P < .001. Probabilities of remaining free of AD as functions of time are shown for atrophy progression scores derived from baseline and 1-year follow-up MR measures. Survival analyses of only those MCI cases with no conversion to AD within the first year were performed. Probabilities at 0–25th (1st quartile), 26th–50th (2nd quartile), 51st–75th (3rd quartile), and 76th–100th (4th quartile) percentiles are shown. (b) Thick curved line on graph illustrates risk of conversion to AD within subsequent year as a continuous function of atrophy progression score percentile. (c) Thick curved line on graph illustrates risk of conversion to AD within subsequent year as a continuous function of atrophy score percentile, derived by using the 1-year MR imaging data as the baseline. Comparison of results in b and c illustrate the additional risk modification information provided by including rate-of-change measures. Atrophy measures from a single time point provide valuable risk information, enabling the identification of individuals at much lower (3%) and much higher (43%) risk of developing AD compared with average group risk of 27% (straight horizontal line in c). However, information derived from follow-up MR imaging enables even greater separation of risk, with the 1-year risk of conversion ranging from a risk similar to that of non–cognitive impaired elderly individuals (3%) to 69% (b).

References

    1. Rafii MS, Aisen PS. Recent developments in Alzheimer’s disease therapeutics. BMC Med 2009;7:7. - PMC - PubMed
    1. Cummings JL, Doody R, Clark C. Disease-modifying therapies for Alzheimer disease: challenges to early intervention. Neurology 2007;69(16):1622–1634 - PubMed
    1. Aisen PS. Commentary on “a roadmap for the prevention of dementia II: Leon Thal Symposium 2008”—facilitating Alzheimer’s disease drug development in the United States. Alzheimers Dement 2009;5(2):125–127 - PMC - PubMed
    1. Black RS, Sperling RA, Safirstein B, et al. A single ascending dose study of bapineuzumab in patients with Alzheimer disease. Alzheimer Dis Assoc Disord 2010;24(2):198–203 - PMC - PubMed
    1. McEvoy LK, Brewer JB. Quantitative structural MRI for early detection of Alzheimer’s disease. Expert Rev Neurother 2010;10(11):1675–1688 - PMC - PubMed

Publication types

MeSH terms