. 2011 Apr 6;31(14):5213-24.
doi: 10.1523/JNEUROSCI.6406-10.2011.

Neural mechanisms of surround attenuation and distractor competition in visual search

Affiliations

Neural mechanisms of surround attenuation and distractor competition in visual search

Carsten N Boehler et al. J Neurosci. .

Abstract

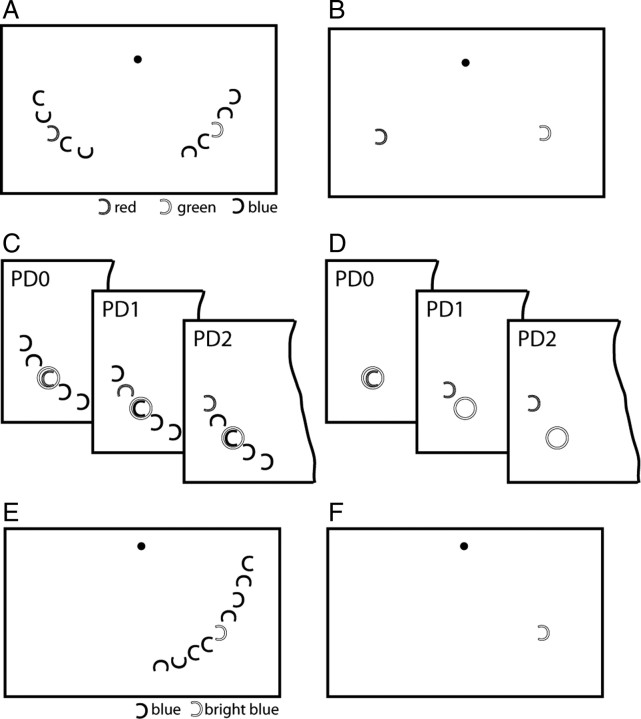
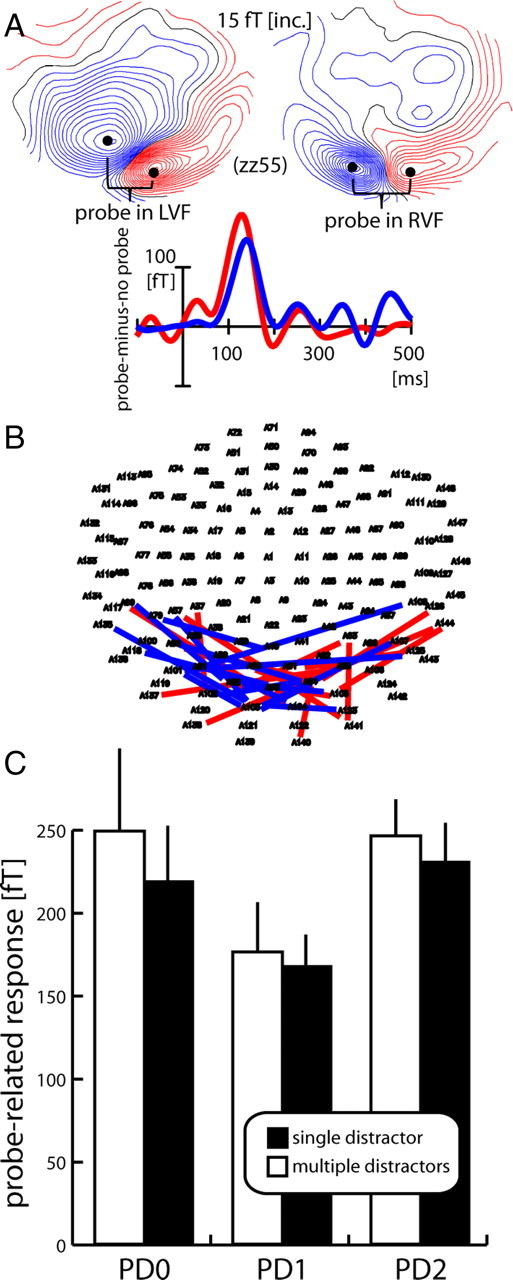
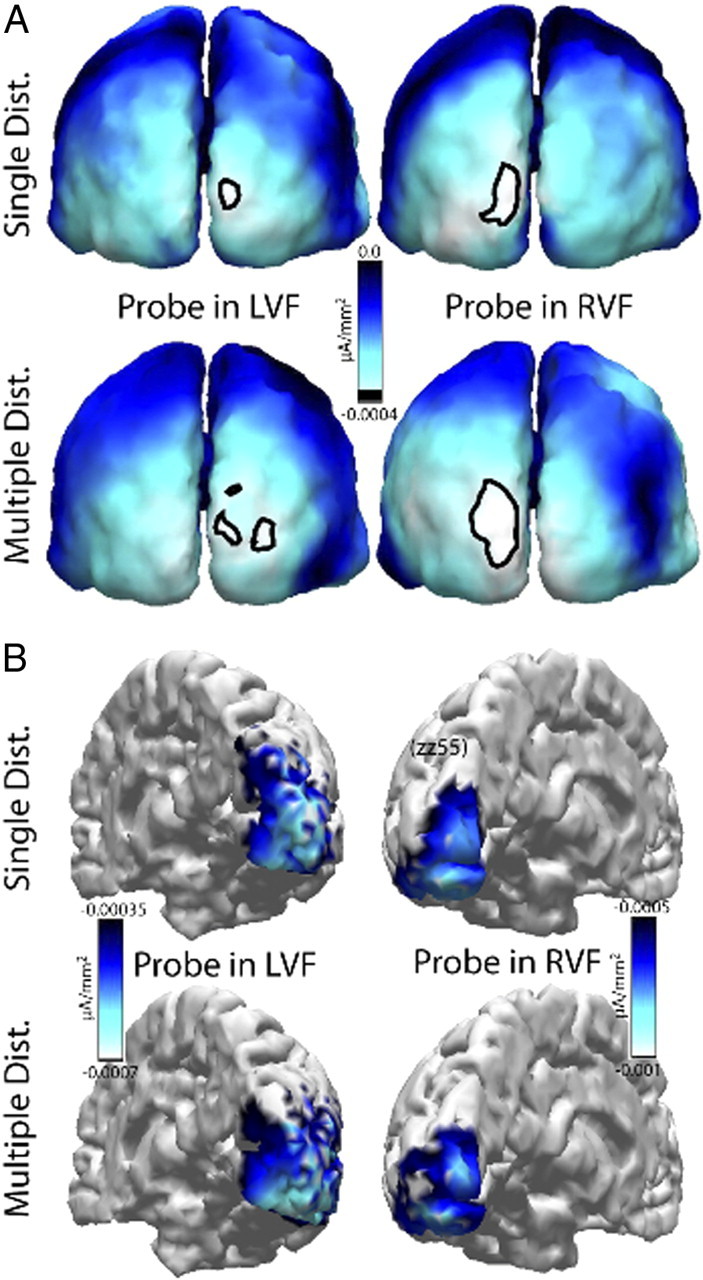
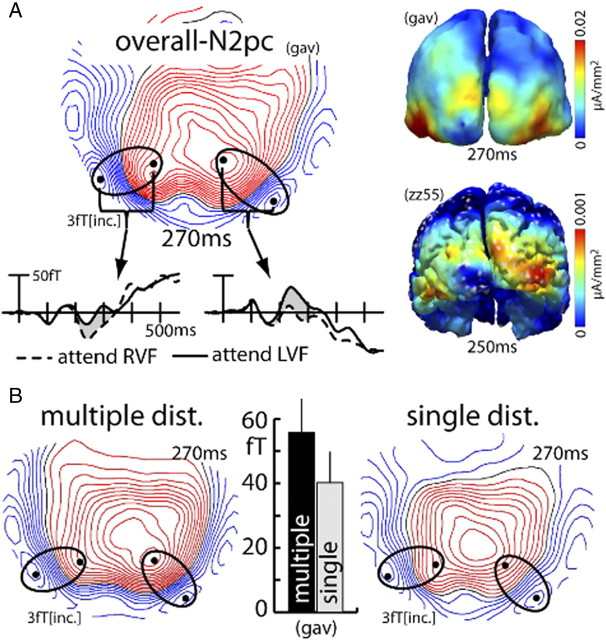
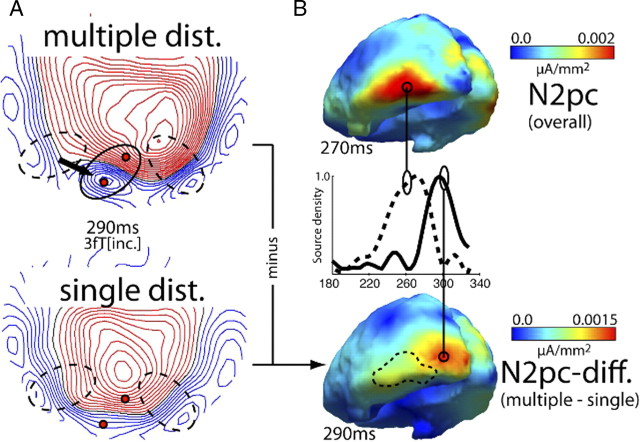
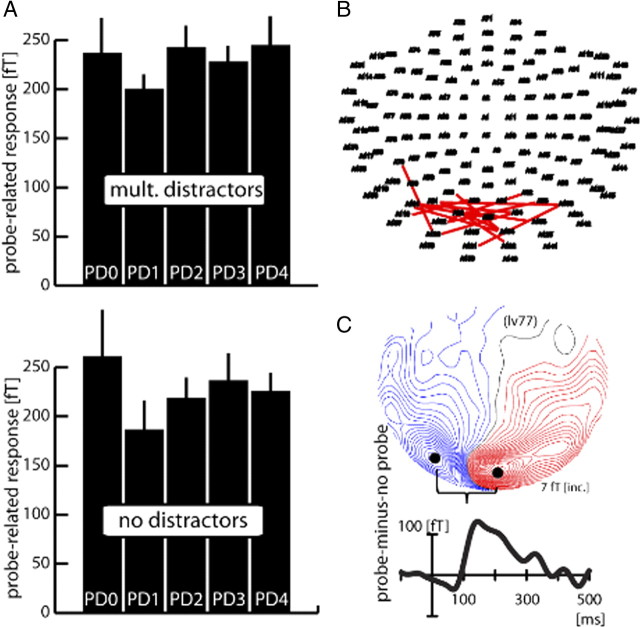
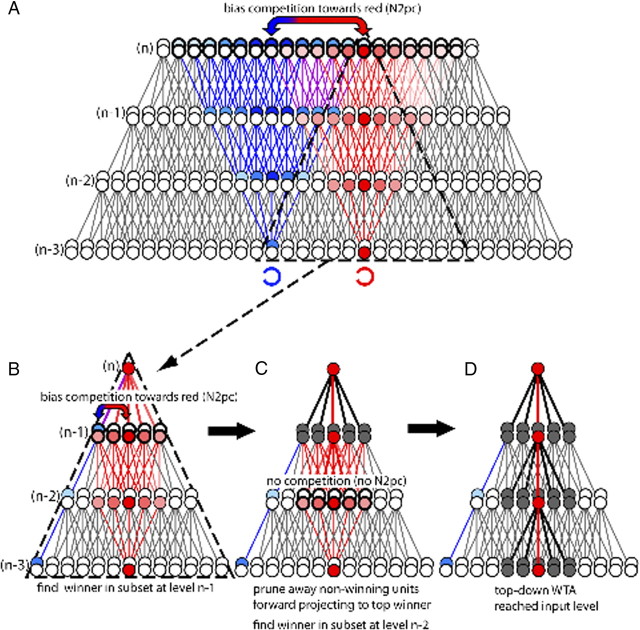
Visual attention biases relevant processing in the visual system by amplifying relevant or attenuating irrelevant sensory input. A potential signature of the latter operation, referred to as surround attenuation, has recently been identified in the electromagnetic brain response of human observers performing visual search. It was found that a zone of attenuated cortical excitability surrounds the target when the search required increased spatial resolution for item discrimination. Here we address the obvious hypothesis that surround attenuation serves distractor suppression in the vicinity of the target where interference from irrelevant search items is maximal. To test this hypothesis, surround attenuation was assessed under conditions when the target was presented in isolation versus when it was surrounded by distractors. Surprisingly, substantial and indistinguishable surround attenuation was seen under both conditions, indicating that it reflects an attentional operation independent of the presence of distractors. Adding distractors in the target's surround, however, increased the amplitude of the N2pc--an evoked response known to index distractor competition in visual search. Moreover, adding distractors led to a topographical change of source activity underlying the N2pc toward earlier extrastriate areas. In contrast, the topography of reduced source activity due to surround attenuation remained unaltered with and without distractors in the target's surround. We conclude that surround attenuation is not a direct consequence of the attenuation of distractors in visual search and that it dissociates from attentional operations reflected by the N2pc. A theoretical framework is proposed that links both operations in a common model of top-down attentional selection in visual cortex.


Figures

Figure 1.
Figure 1.
Stimulus setup and probe procedure (experiments 1 and 2). A, Example search array of the multiple-distractor condition of experiment 1. The popout target (the red or the green C) was presented together with four blue distractors in its surround. B, Example array of the single-distractor condition of experiment 1. The target was presented together with only one distractor in the opposite VF. C, D, Illustration of the three attention-to-probe distances in experiment 1. When presented, the probe (the white ring) always appeared at the center item location (C) or the corresponding blank location (D) in the target VF. E, F, Example search arrays of the multiple- (E) and no- (F) distractor conditions in experiment 2. Trials of the multiple- and no-distractor conditions were run in separate and alternating experimental blocks.
Figure 2.
Figure 2.
Probe response and surround-attenuation effect (experiment 1). A, Mean ERMF response to the probe (FP-minus-FO difference, average over all probe-distance conditions) in one representative subject (zz55). The maps show the ERMF distribution at 130 ms after probe onset in the left (left map) and right VF (right map) visible as efflux–influx configurations over central occipital regions, with red lines representing the efflux and blue lines the influx component of the field; the waveforms represent the response to left VF (red trace) and right VF probes (blue trace) collapsed over measurements from sensors (black dots) showing efflux and influx maxima (efflux-minus-influx difference). B, Localization of individual maxima of efflux–influx configurations in each subject for probes in the left (red lines) and right (blue lines) VF. Each line connects sensors showing efflux and influx maxima of a given subject. C, Grand average (over subjects and VF of probe presentation) probe-related response (FP-minus-FO difference) as a function of distance to the focus of attention for the single- (black) and multiple- (white) distractor conditions. Error bars show the SEM.
Figure 3.
Figure 3.
Source density analysis of the surround-attenuation effect (experiment 1). Cortical distribution of the surround-attenuation effect (PD2-minus-PD1 ERMF difference) of the single- and multiple-distractor conditions revealed by probes presented in the left (left column) and the right (right column) VF. A, Current source density estimates of the grand average (over subjects) attenuation of the probe-related response. The outlines index the attenuation maxima at the threshold marked by the black line in the scale bar. B, Source density estimates of the surround attenuation effect in a single representative subject (zz55). A negative scale was chosen to highlight that the maps show the distribution of attenuated responses.
Figure 4.
Figure 4.
N2pc effect (experiment 1). A, Waveforms, ERMF distribution, and current source density estimates of the overall N2pc [grand average (gav) over subjects; collapsed over distractor conditions; FO-trials only]. The waveforms show the response recorded at sensor sites (black dots) positioned over maxima of the efflux–influx configurations. The response was collapsed over measurements from sensors (black dots) representing corresponding efflux and influx maxima (efflux-minus-influx difference). The N2pc effect is visible as the difference between waveforms (gray area) elicited by targets in the left (solid traces) and right (dashed traces) VF between ∼200 and 330 ms after search frame onset. The activation maps on the right show the current source density distribution of the N2pc of the grand average (top) and of a single representative subject (zz55, bottom). B, Field distribution of the multiple- (top) and single- (bottom) distractor conditions of the grand average N2pc at 270 ms. The bar graph shows the amplitude of the grand average (gav) N2pc response separately for the two distractor conditions (collapsed over left and right hemisphere responses).
Figure 5.
Figure 5.
ERMF distribution underlying the N2pc at 290 ms (experiment 1). A, ERMF distribution of the N2pc (average over subjects) of the multiple- (top) and single- (bottom) distractor conditions 290 ms after search frame onset. The multiple-distractor condition shows an additional posterior occipital effect (solid ellipse) not present in the single-distractor condition. Field effects underlying the N2pc at 270 ms (compare Fig. 4) are marked by dashed ellipses. B, Current density distribution of the overall N2pc (top) in comparison to estimates computed based on the N2pc difference between the multiple- and the single-distractor conditions (estimates from the average ERMF response over subjects). The traces in the middle show the normalized time course of source activity obtained from the indicated locations (circles). The dashed contour in the lower map shows the distribution of the overall N2pc source activity at 270 ms as a comparison.
Figure 6.
Figure 6.
Probe response and surround-attenuation effect (experiment 2). A, Average probe response (over subjects) as a function of distance to the focus of attention (PD0–PD4) for the multiple-distractor (top) and the no-distractor (bottom) conditions. The bar graphs represent the average ERMF response between 120 and 140 ms after probe onset. Equivalent probe distances toward the horizontal and vertical meridian were collapsed. Before averaging over subjects, the size of the probe-related response was determined in each subject by measuring the amplitude difference between the individual efflux and influx maxima representing the probe-related response. B, Localization of efflux–influx maxima of each subject (n = 14) participating in experiment 2. Each red line connects the efflux and influx maximum of the probe-related response of one subject. C, Probe-related ERMF response (FP-minus-FO difference averaged over all probe-distance conditions) of a single representative subject (lv77).
Figure 7.
Figure 7.
Linking the N2pc and surround attenuation in the ST model of visual attention. A, Illustration of the feedforward activation pattern elicited by two search items (a red target and a blue distractor C) in a four-level hierarchical connectivity model of the retinotopic visual cortex. Feedforward activations are represented by diverging pyramids (fan-out factor of 5:1) of red and blue units, which show increasing overlap toward the top level (n) associated with an increase of competition among units representing the target and the distractor. To find a global winner representing the target at the top level (the dark red unit), top-down attention must decide the competition in favor of the red units—an operation proposed to be indexed by the N2pc (double arrow). This sets the starting point for a top-down propagating WTA process to increase the spatial resolution of discrimination beyond that of the top-level units. B, Downward divergent connectivity associated with the top-level winner (units within dashed pyramid in A) determines the extension of the WTA process at the next lower level (n − 1). At n − 1, a new winner is determined (dark red) and connections from nonwinning units to the next level winner (n) are pruned (black lines and gray units in C). This process propagates downwards until the input level (n − 3) is reached (D), thereby leaving a pass zone matching the spatial resolution of units at the input level surrounded by attenuation (surround attenuation). Note that at level n − 1, the forward projection from blue units still overlaps with units representing the red input, which gives rise to competition (double arrow in B) and therefore modulatory effects producing the N2pc. In contrast, at level n − 2, red-representing units projecting to the winner at level n − 1 do not overlap with blue units. Hence, no competition arises and no N2pc response appears.

References

    1. Awh E, Matsukura M, Serences JT. Top-down control over biased competition during covert spatial orienting. J Exp Psychol Hum Percept Perform. 2003;29:52–63. - PubMed
    1. Bles M, Schwarzbach J, De Weerd P, Goebel R, Jansma BM. Receptive field size-dependent attention effects in simultaneously presented stimulus displays. Neuroimage. 2006;30:506–511. - PubMed
    1. Boehler CN, Tsotsos JK, Schoenfeld MA, Heinze H-J, Hopf JM. The center-surround profile of the focus of attention arises from recurrent processing in visual cortex. Cereb Cortex. 2009;19:982–991. - PubMed
    1. Buffalo EA, Fries P, Landman R, Liang H, Desimone R. A backward progression of attentional effects in the ventral stream. Proc Natl Acad Sci U S A. 2010;107:361–365. - PMC - PubMed
    1. Chelazzi L, Miller EK, Duncan J, Desimone R. A neural basis for visual search in inferior temporal cortex. Nature. 1993;363:345–347. - PubMed

Publication types

MeSH terms

LinkOut - more resources