. 2011 Apr 6;31(14):5365-77.
doi: 10.1523/JNEUROSCI.6472-10.2011.

Multisensory processing in spatial orientation: an inverse probabilistic approach

Affiliations

Multisensory processing in spatial orientation: an inverse probabilistic approach

Ivar A H Clemens et al. J Neurosci. .

Abstract

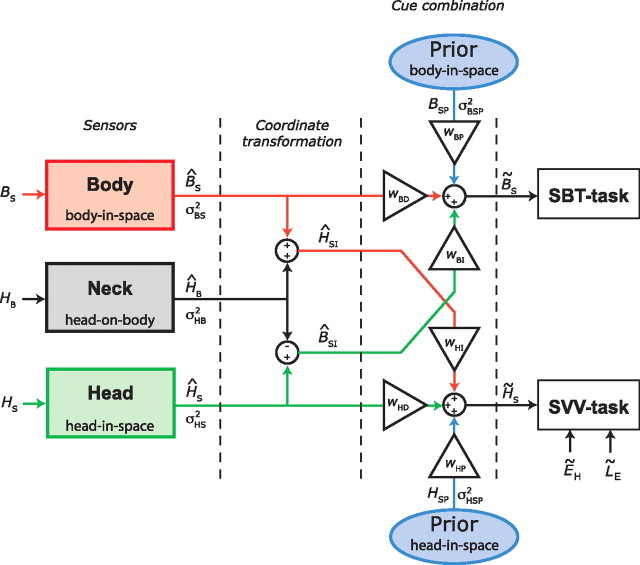
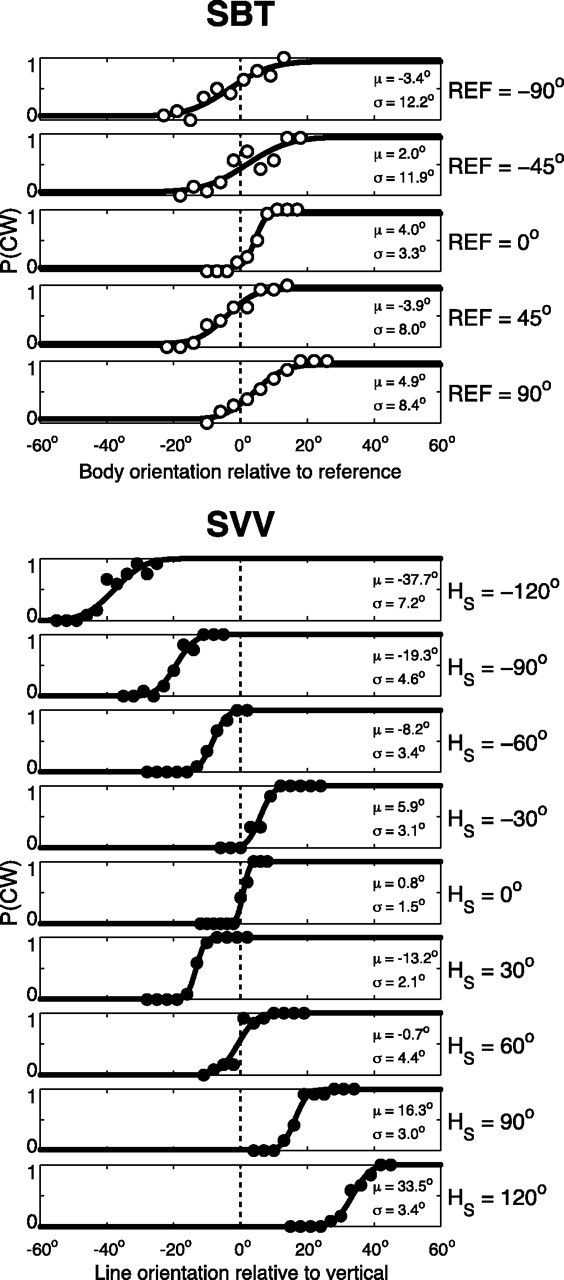
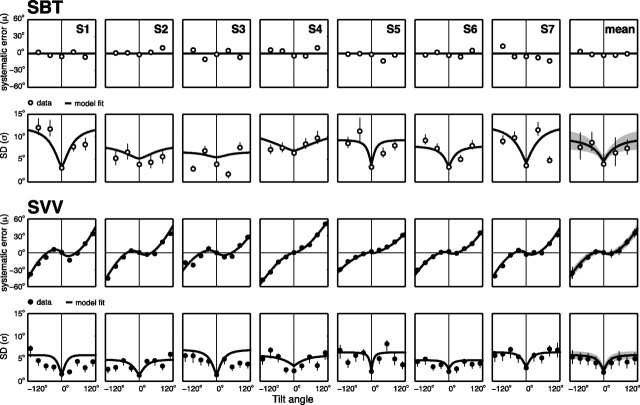
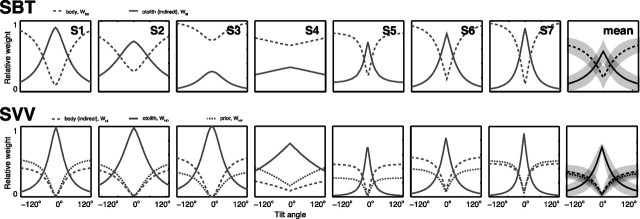
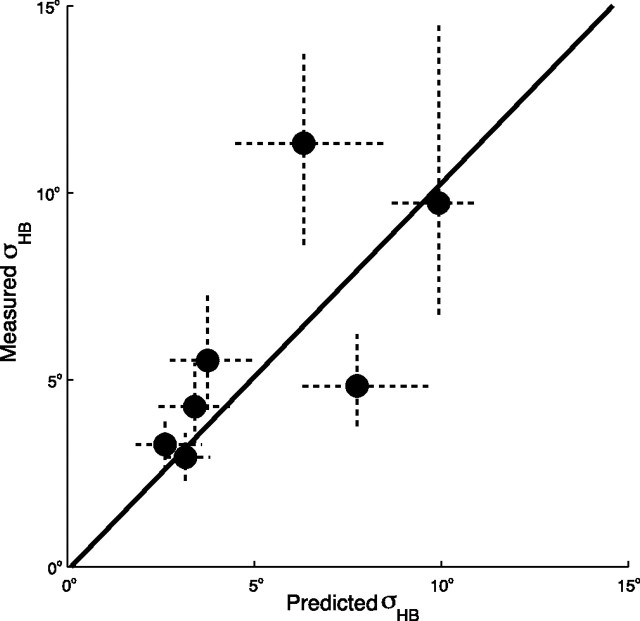
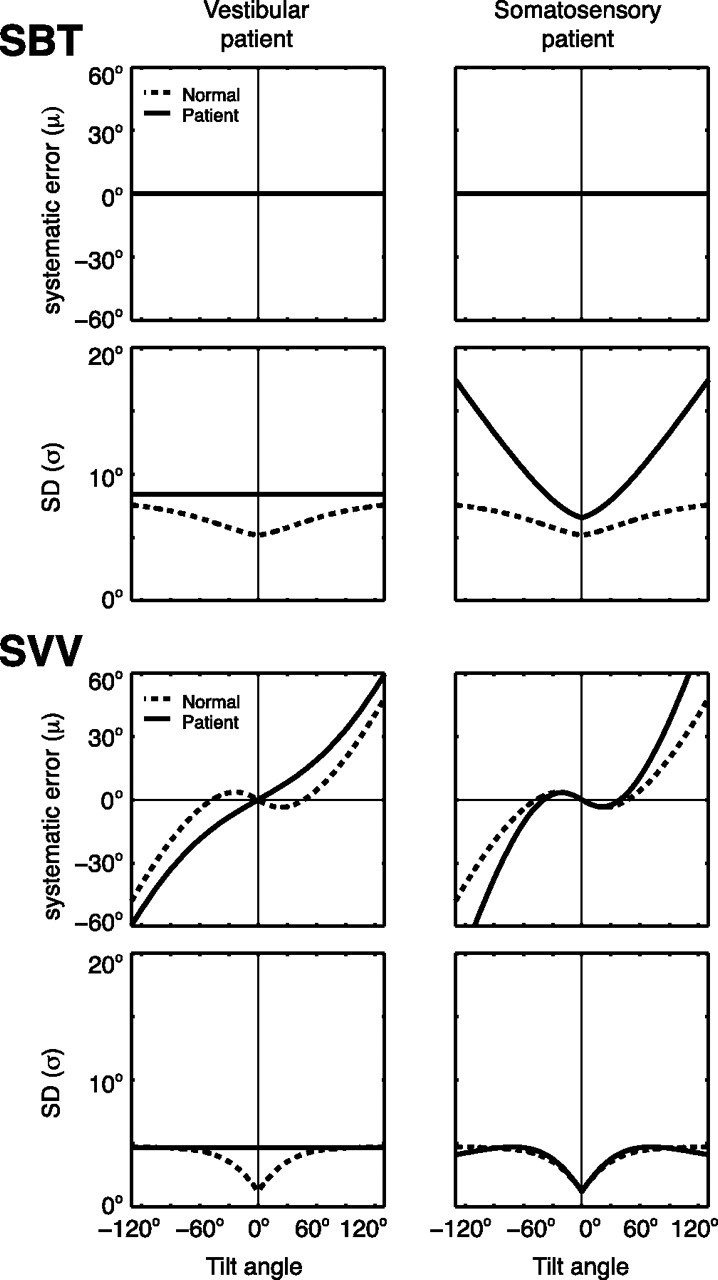
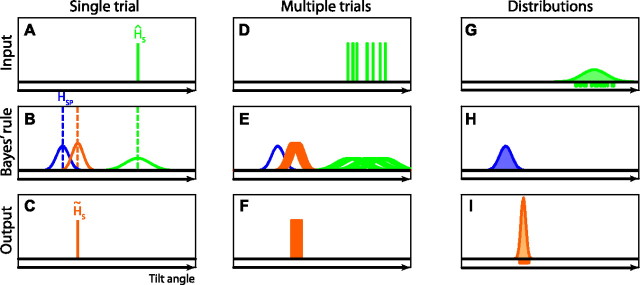
Most evidence that the brain uses Bayesian inference to integrate noisy sensory signals optimally has been obtained by showing that the noise levels in each modality separately can predict performance in combined conditions. Such a forward approach is difficult to implement when the various signals cannot be measured in isolation, as in spatial orientation, which involves the processing of visual, somatosensory, and vestibular cues. Instead, we applied an inverse probabilistic approach, based on optimal observer theory. Our goal was to investigate whether the perceptual differences found when probing two different states--body-in-space and head-in-space orientation--can be reconciled by a shared scheme using all available sensory signals. Using a psychometric approach, seven human subjects were tested on two orientation estimates at tilts < 120°: perception of body tilt [subjective body tilt (SBT)] and perception of visual vertical [subjective visual vertical (SVV)]. In all subjects, the SBT was more accurate than the SVV, which showed substantial systematic errors for tilt angles beyond 60°. Variability increased with tilt angle in both tasks, but was consistently lower in the SVV. The sensory integration model fitted both datasets very nicely. A further experiment, in which supine subjects judged their head orientation relative to the body, independently confirmed the predicted head-on-body noise by the model. Model predictions based on the derived noise properties from the various modalities were also consistent with previously published deficits in vestibular and somatosensory patients. We conclude that Bayesian computations can account for the typical differences in spatial orientation judgments associated with different task requirements.


Figures

Figure 1.
Figure 1.
Schematic representation of the sensory integration model. Sensory signals, denoted by a hat symbol (∧), are assumed to be calibrated accurately, but contaminated by Gaussian noise. Optimal estimates are denoted by a tilde (∼). Body sensors, neck sensors, and otoliths provide information about orientation of body in space (BS), head on body (HB), and head in space (HS), respectively. Neck signal (ĤB) is used for a reference frame transformation of otolith information into a body-in-space signal (ĤSĤB = SI), and for a transformation of body-tilt information into a head-in-space signal (S + ĤB = ĤSI). For an optimal estimate of body-in-space orientation, S (SBT task), the model combines the body-sensor signal (S, red pathway) with a reference-frame-transformed otolith signal (SI, green pathway). Relative contributions of the two pathways (wBD and wBI) depend on their relative precision (Eq. 2). The scheme shows a symmetrical arrangement with two priors, but there is ample reason to believe that their effects are not identical. The simplest explanation of current and previous SBT data (see Materials and Methods, SBT computation) indicates that the associated prior in this task is uniform, which implies that wBP can be ignored. In the SVV task, an optimal estimate of head-in-space (S) is obtained by integration of otolith information (ĤS, green pathway), reference-frame-transformed information from body sensors (ĤSI, red pathway), and a significant contribution from prior information (HSP, blue pathway). Relative weights are denoted by wHD, wHI, and wHP, respectively. Estimate of line-in-space orientation is obtained by combining S and estimates of eye-in-head (H) and line-on-eye (E) orientation. Noise variance in body sensors (σBS2), neck sensors (σHB2), otoliths (σHS2), and width of prior (σHSP2) defines their relative weights (see Materials and Methods). Otolith noise may depend on tilt angle (Eq. 11). Note that the process of sensory integration, denoted here by summation of weighted sensory signals, is equivalent to multiplication of the underlying probability distributions (Eqs. 2 and 6 and Appendix).
Figure 2.
Figure 2.
Tilt paradigm in SBT90 task. T1, T2, T3, Test angles at which the subject was prompted with a beep signal (*) to indicate whether body orientation was CW or CCW from the instructed reference orientation (i.e., 90° in this example). D1, D2, Detour angles randomly drawn from detour range (30–40° CW and CCW from center of test range). Rotations from detour (D) to test (T) angle were performed in a noisy fashion (see Materials and Methods, SBT).
Figure 3.
Figure 3.
SBT versus SVV performance in one subject (S1). Top, SBT. Proportion of CW responses is plotted against body orientation relative to the reference orientation (0°, ±45°, or ±90°). μ > 0° indicates tilt underestimation. Bottom, SVV. Proportion of CW responses is plotted against line orientation relative to vertical. Solid lines, Best-fit cumulative Gaussians, typified by μ and σ.
Figure 4.
Figure 4.
Model predictions superimposed on parameters from the psychometric fits to the SBT (two top rows) and SVV data (two bottom rows). Accuracy and variability characteristics as a function of roll-tilt angle are shown; values are psychometric fits (μ and σ values, ○) and model predictions (line) from all subjects. Mean data and mean predictions across subjects are plotted in the rightmost column.
Figure 5.
Figure 5.
Tilt dependence of weight factors in SBT (top) and SVV (bottom) for each subject. Trends with tilt angle are similar for all subjects. Head-in-space prior is only involved in SVV computations. Means across subjects are plotted in the rightmost column.
Figure 6.
Figure 6.
Model validation. Independent measurement of neck (head-on-body) noise versus the values predicted by the model. The dots represent the median values and the dashed lines the 95% confidence interval determined from a bootstrap. Note that the variance of the estimates increases with the mean value. The solid line shows the regression based on log-transformed data (slope, 1.03; p = 0.04).
Figure 7.
Figure 7.
Clinical implications of the model. The model simulates the SBT and SVV in a vestibular patient by raising the level of the otolith noise to infinity, keeping the other parameters at the mean values of Table 1. A somatosensory patient is modeled by setting the noise level of the body sensors to infinity. Solid lines, Patient predictions. Dashed lines, Prediction for normals.
Figure 8.
Figure 8.
Bayesian computations in single and multiple trials. A–C, Single trial. D–F, Multiple trials. G–I, Resulting distributions. For further explanation, see Appendix.

References

    1. Alais D, Burr D. The ventriloquist effect results from near-optimal bimodal integration. Curr Biol. 2004;14:257–262. - PubMed
    1. Angelaki DE, Cullen KE. Vestibular system: the many facets of a multimodal sense. Annu Rev Neurosci. 2008;31:125–150. - PubMed
    1. Aubert H. Eine scheinbare bedeutende Drehung von Objecten bei Neigung des Kopfes nach rechts oder links. Virchows Archiv. 1861;20:381–393.
    1. Bays PM, Wolpert DM. Computational principles of sensorimotor control that minimize uncertainty and variability. J Physiol. 2007;578:387–396. - PMC - PubMed
    1. Benson AJ, Hutt EC, Brown SF. Thresholds for the perception of whole body angular movement about a vertical axis. Aviat Space Environ Med. 1989;60:205–213. - PubMed

Publication types

LinkOut - more resources