. 2011 Jun;105(6):3054-66.
doi: 10.1152/jn.00136.2011. Epub 2011 Apr 6.

Physiological identification and infralimbic responsiveness of rat intercalated amygdala neurons

Affiliations

Physiological identification and infralimbic responsiveness of rat intercalated amygdala neurons

Alon Amir et al. J Neurophysiol. 2011 Jun.

Abstract

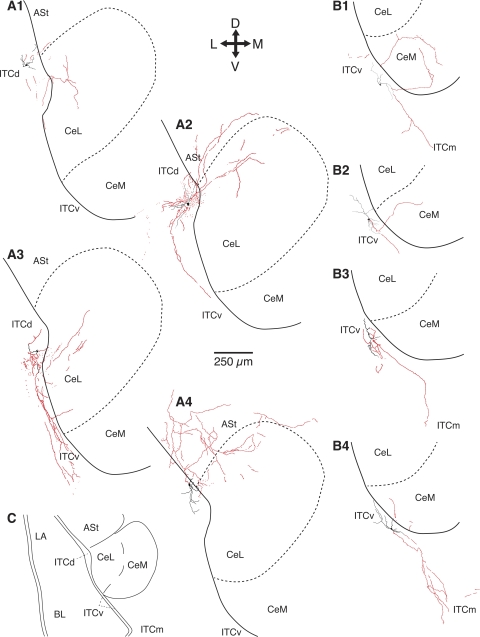
Intercalated (ITC) amygdala neurons are thought to play a critical role in the extinction of conditioned fear. However, several factors hinder progress in studying ITC contributions to extinction. First, although extinction is usually studied in rats and mice, most ITC investigations were performed in guinea pigs or cats. Thus it is unclear whether their connectivity is similar across species. Second, we lack criteria to identify ITC cells on the basis of their discharge pattern. As a result, key predictions of ITC extinction models remain untested. Among these, ITC cells were predicted to be strongly excited by infralimbic inputs, explaining why infralimbic inhibition interferes with extinction. To study the connectivity of ITC cells, we labeled them with neurobiotin during patch recordings in slices of the rat amygdala. This revealed that medially located ITC cells project topographically to the central nucleus and to other ITC clusters located more ventrally. To study the infralimbic responsiveness of ITC cells, we performed juxtacellular recording and labeling of amygdala cells with neurobiotin in anesthetized rats. All ITC cells were orthodromically responsive to infralimbic stimuli, and their responses usually consisted of high-frequency (~350 Hz) trains of four to six spikes, a response pattern never seen in neighboring amygdala nuclei. Overall, our results suggest that the connectivity of ITC cells is conserved across species and that ITC cells are strongly responsive to infralimbic stimuli, as predicted by extinction models. The unique response pattern of ITC cells to infralimbic stimuli can now be used to identify them in fear conditioning experiments.


Figures

Fig. 1.
Fig. 1.
Identification of intercalated (ITC) cell clusters. Two adjacent coronal sections of the rat amygdala (100-μm thickness) are shown. A: counterstaining with cresyl violet. B: distribution of immunoreactivity for μ-opioid receptors (μORs). Note that darkly stained clusters of cells on the section counterstained with cresyl violet (arrows in A) correspond to patches of dense immunolabeling for μORs (arrows in B). BL, basolateral; CeL, central lateral nucleus; CeM, central medial nucleus; OT, optic tract; ITCd, dorsal ITC cluster; ITCv, ventral ITC cluster; ITCm, large (main) ITC cluster.
Fig. 2.
Fig. 2.
Morphological properties of ITC neurons. Whole cell patch recordings of ITC cells were obtained in brain slices kept in vitro. ITC cells were labeled with neurobiotin present in the pipette solution. A–C: 3 different ITC cells. A1 and B1 are low-power photomicrographs showing the position of the cells on coronal sections counterstained with cresyl violet. A2–A4, B2–B4, and C are high-power photomicrographs of the same ITC cells. The dendritic trees of ITC cells ranged from stellate (A2) to flattened (B2). They had varicose axons (A3 and B3) that contributed 2 or more collaterals. ITC cells displayed a moderate to high density of dendritic spines (A4 and B4). LA, lateral nucleus; EC, external capsule.
Fig. 3.
Fig. 3.
Axonal projection patterns of ITC cells located in the cluster adjacent to CeL (ITCd; A) or to CeM (ITCv; B). All the depicted cells were recorded in vitro. The scheme in C shows a general view of the amygdala nuclei depicted in A and B. The orientation of the sections is indicated by the cross at top, where L, M, D, and V stand for lateral, medial, dorsal, and ventral, respectively. Red, axons; black, dendritic segments. ITCd cells contributed axon collaterals to one or more of the following sites: CeL (A1–A4), the amygdalostriatal transition area (ASt; A2 and A4), or ITCv cells (A2 and A3). ITCv cells contributed axon collaterals to CeM (B1, B2, and B4) and/or to ITCm (B1, B3, and B4).
Fig. 4.
Fig. 4.
Contrasting responsiveness of BL, central nucleus (Ce), and ITC cells to electrical stimuli delivered in the infralimbic (IL) cortex and brain stem (BS). Single-unit recordings of amygdala neurons were obtained with high-impedance micropipettes in urethane-anesthetized rats. A: scheme showing 29 electrode tracks with dots indicating the position of recorded cells. In all 29 cases, an amygdala neuron was juxtacellularly labeled with neurobiotin and its position used to infer the location of all recorded cells. In 3 of these tracks (arrow and open circles), the labeled cells were located in the LA. In the remaining tracks, we attempted to label cells near the Ce-BL border. The 19 cases where the recovered cells were within ≤0.2 mm of the Ce-BL border are depicted in Fig. 6B. B–D: proportion of responsive BL, Ce, and ITC cells to electrical stimuli delivered in IL (B and C) or BS (D and E). Antidromic responses are shown in B and D; orthodromic responses are shown in C and E. AST, amygdalostriatal transition; BLA, basolateral amygdala; STR, striatum.
Fig. 5.
Fig. 5.
Examples of unit responses elicited by electrical stimuli delivered in IL (A–C) or BS (D and E). A and B show data for 2 different BL neurons, D shows a Ce cell, and C and E show LA neurons. In a high proportion of BL neurons (but never in Ce cells), IL stimulation elicited antidromic response characterized by fixed latency (A, top) and collision with spontaneous action potentials (A, bottom). In a few BL cells, IL stimulation evoked orthodromic responses consisting of single spikes (B) or, very rarely, spike bursts (C). The latter response pattern was only seen in 3 LA cells (their position is marked by an arrow in Fig. 4A). In a high proportion of Ce neurons (but never in BL cells), BS stimuli elicited antidromic responses characterized by a fixed latency (D, top) and collision with spontaneous action potentials (D, bottom). BS stimuli elicited orthodromic responses in a few rare LA cells (E).
Fig. 6.
Fig. 6.
The position of the BL-Ce border can be identified on the basis of the contrasting pattern of antidromic responsiveness of Ce and BLA neurons to BS and IL stimuli, respectively. A: number of cells backfired from the BS (solid bars) or IL (open bars) plotted as a function of depth relative to the BLA-Ce border in 29 microelectrode tracks. B: position of 19 neurons juxtacellularly labeled with neurobiotin in, or at proximity of (≤0.2 mm), the BLA-Ce border as identified during the experiments using physiological criteria. Filled circles represent positively identified ITC cells (n = 12), whereas open squares represent Ce, ASt, or BLA neurons.
Fig. 7.
Fig. 7.
ITC cells can be identified during extracellular recordings on the basis of their unusual IL responsiveness. By using the contrasting pattern of antidromic responsiveness of Ce and BL neurons to BS and IL stimuli, the location of the Ce-BL border was identified. Juxtacellular recordings of border cells were then obtained. After their responsiveness to IL and BS stimuli was examined, the cells were labeled with neurobiotin. Bar graphs in A compare the proportion of morphologically and/or histologically identified ITC, Ce, and BL neurons responding to IL stimuli with high-frequency spike bursts (A1), the number of spikes in these bursts (A2), the first interspike interval (ISI) duration in these bursts (A3), and their latency (A4). B–D show examples of morphologically-identified ITC cells (B1, C1, and D1) and their responses to IL stimuli (B2, C2, and D2). Higher power micrographs of the cells shown in B–D are provided in E1, E2, and E4, respectively. A drawing of the cell in D1 and E4 is shown in E3 (red, axon; black, soma and dendrites).
Fig. 8.
Fig. 8.
Overlapping distributions of action potential properties and firing rates in ITC, BL, and Ce neurons. Graphs are frequency distributions for 3 different variables: spike duration (A), rising slope of action potentials (B; inferred from interval between 25 and 75% of peak amplitude; absolute values, normalized for amplitude), and firing rates (C). Data were obtained in ITC (A1, B1, and C1; n = 12), BL (A2, B2, and C2; n = 71), and Ce neurons (A3, B3, and C3; n = 158). In A–C, identified projection cells of BL and Ce are represented by open bars, whereas filled bars indicate cells that could not be backfired. The 4 arrows in A2, B2, and C2 indicate 4 morphologically identified aspiny neurons. These presumed local-circuit cells had shorter spikes with faster rise times and relatively high firing rates compared with the rest of the population. Inset in B1 shows how the spike rising slope was measured. Various methods were used to estimate action potential durations (as in Likhtik et al. 2006), but all failed to reveal differences between cells in the 3 nuclei. D: spontaneous activity of a representative ITC cell (depicted in Fig. 7, E3 and E4). ITC firing rates were very low. The firing rate of this cell was around 0.3 Hz.
Fig. 9.
Fig. 9.
Multiple superimposed layers of inhibition between the input and output stations of the amygdala. Scheme summarizes the major direct excitatory (solid) and indirect inhibitory (shaded) pathways linking the basolateral amygdala to the central nucleus. LA neurons target ITCd cells (arrow 1) that in turn inhibit CeL neurons (arrow 2), whereas BL neurons drive ITCv cells (arrow 3), resulting in the inhibition of CeM neurons (arrow 4). In addition, there are inhibitory projections from ITCd to ITCv cells (arrow 5), as well as from CeL to CeM (arrow 6). Note that the recruitment of ITCd cells by LA neurons during the conditioned stimulus should produce a parallel inhibition of ITCv cells and CeL neurons, resulting in the disinhibition of fear output neurons in CeM. We hypothesize that fear conditioning produces a potentiation of LA inputs to ITCd cells, whereas extinction training causes a potentiation of BL inputs to ITCv neurons. The latter view is in apparent contradiction with the fact that IL projects to both ITCd and ITCv clusters and that ITCd cells inhibit ITCv neurons. This raises the following question: can IL inputs to ITCv cells overcome the inter-ITC inhibition to inhibit CeM cells? According to a recent modeling study (Li et al. 2011), IL inputs are so strong that they can overcome the inter-ITC inhibition to cause a marked increase in the firing rate of ITCv cells, leading to a persistent decrease in CeM output. Last, it should be mentioned that to improve readability, the scheme does not include 2 well-established facts about this circuit, namely, the existence of BL projections to CeL (Krettek and Price 1978) and the presence of two CeL cell types with opposite responses to conditioned stimuli but unknown connectivity with ITC cells. The latter are discussed in the text.

Similar articles

Cited by

References

    1. Amano T, Unal CT, Paré D. Synaptic correlates of fear extinction in the amygdala. Nat Neurosci 13: 489–494, 2010 - PMC - PubMed
    1. Berretta S, Pantazopoulos H, Caldera M, Pantazopoulos P, Paré D. Infralimbic cortex activation increases c-Fos expression in intercalated neurons of the amygdala. Neuroscience 132: 943–953, 2005 - PMC - PubMed
    1. Blechert J, Michael T, Vriends N, Margraf J, Wilhelm FH. Fear conditioning in posttraumatic stress disorder: evidence for delayed extinction of autonomic, experiential, and behavioural responses. Behav Res Ther 45: 2019–2033, 2007 - PubMed
    1. Busti D, Geracitano R, Whittle N, Dalezios Y, Manko M, Kaufmann W, Sätzler K, Singewald N, Capogna M, Ferraguti F. Different fear states engage distinct networks within the intercalated cell clusters of the amygdala. J Neurosci 31: 5131–5144, 2011 - PMC - PubMed
    1. Cassell MD, Wright DJ. Topography of projections from the medial prefrontal cortex to the amygdala in the rat. Brain Res Bull 17: 321–333, 1986 - PubMed

Publication types