. 2011 Nov;21(11):2620-38.
doi: 10.1093/cercor/bhr048. Epub 2011 Apr 6.

Descending projections from extrastriate visual cortex modulate responses of cells in primary auditory cortex

Affiliations

Descending projections from extrastriate visual cortex modulate responses of cells in primary auditory cortex

Matthew I Banks et al. Cereb Cortex. 2011 Nov.

Abstract

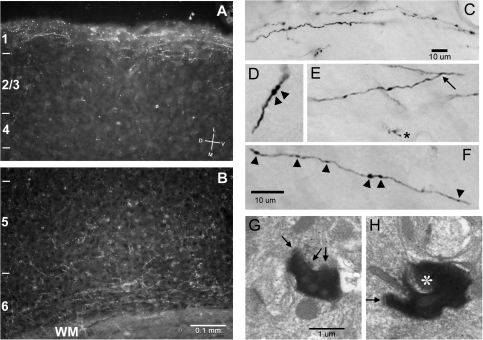
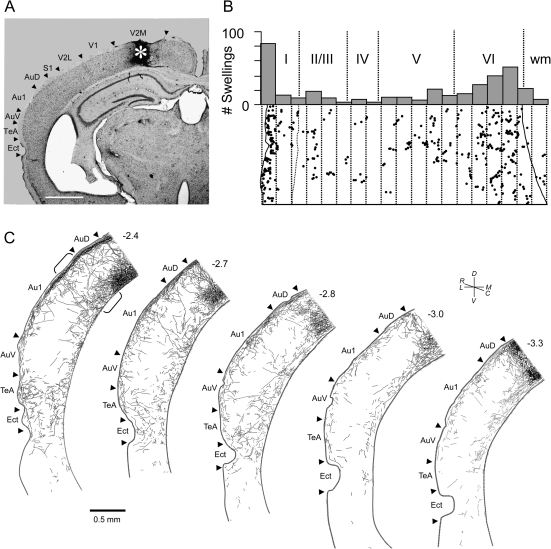
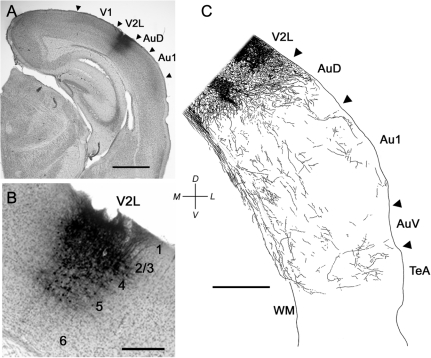
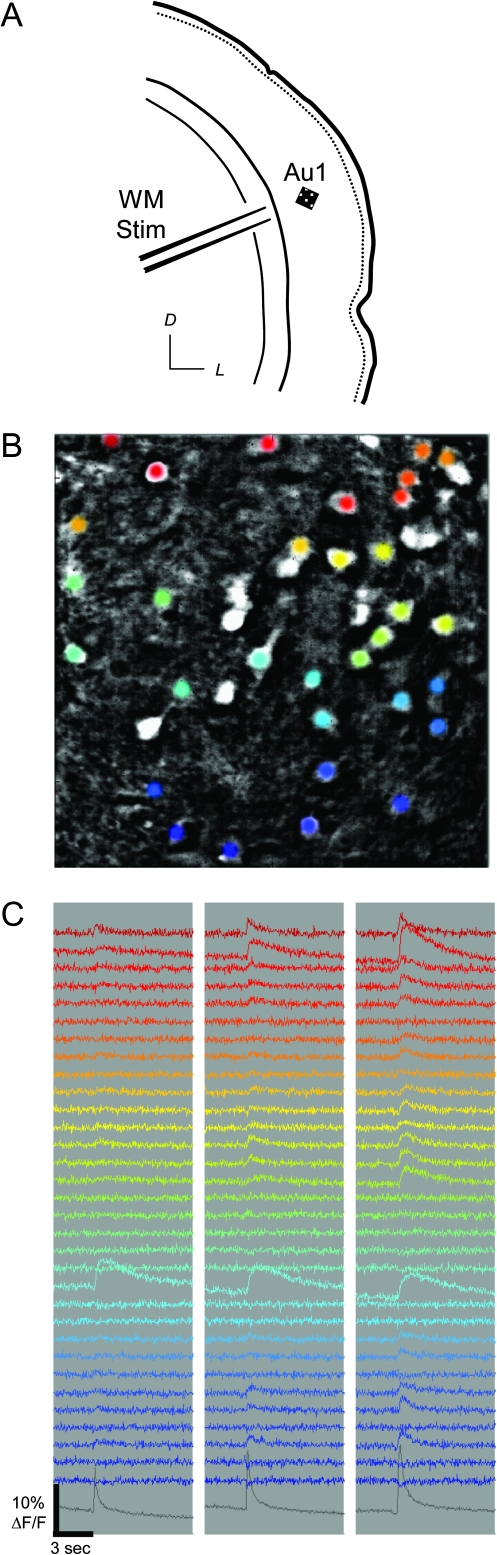
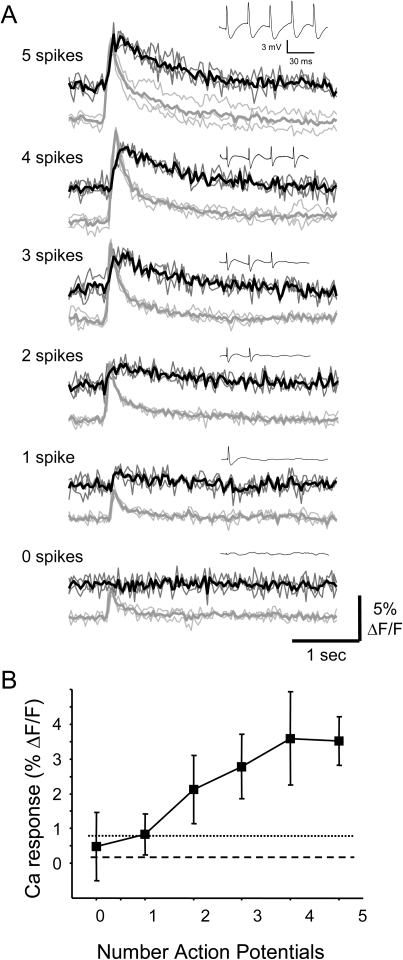
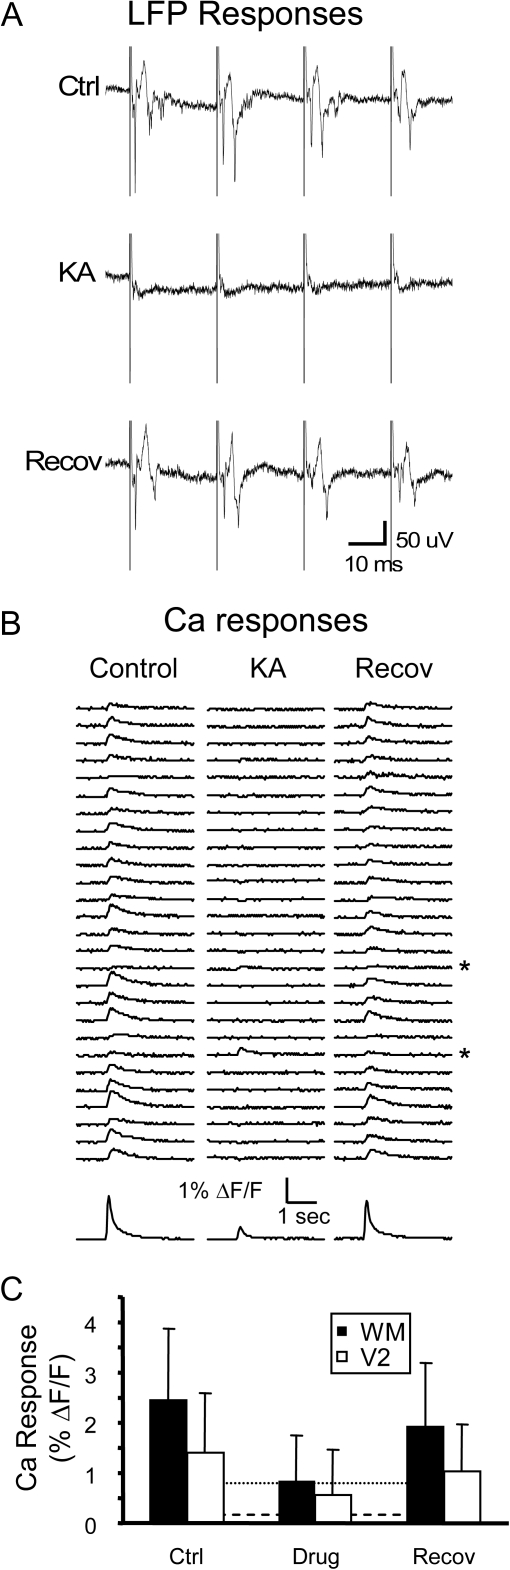
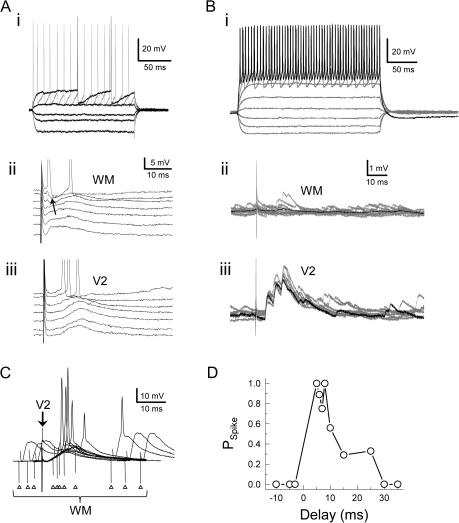
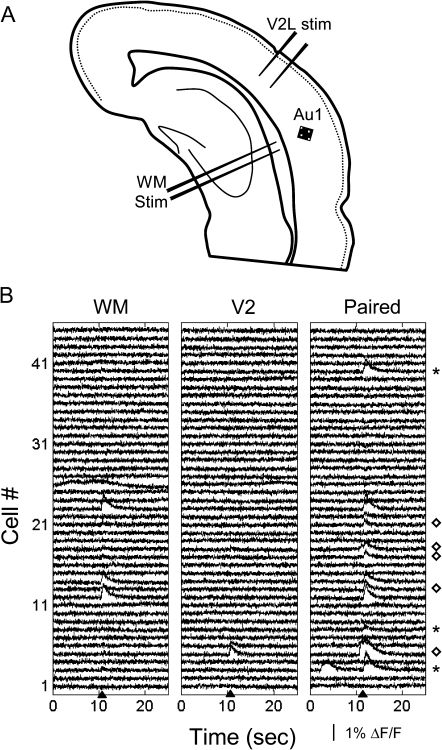
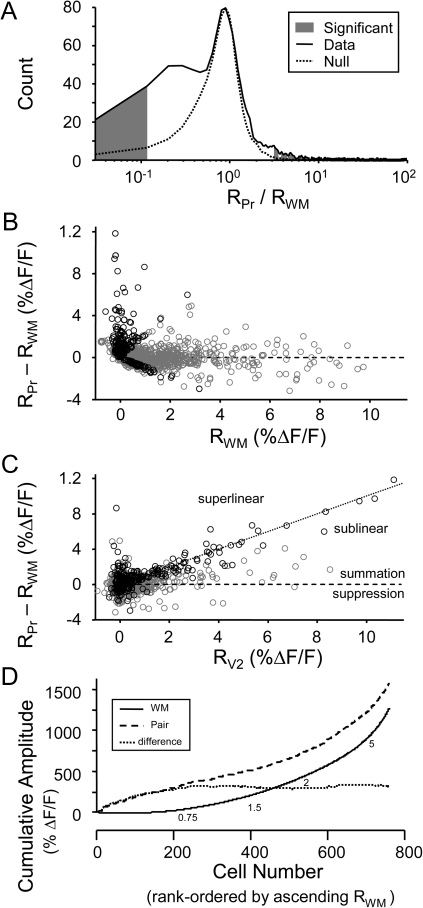
Primary sensory cortical responses are modulated by the presence or expectation of related sensory information in other modalities, but the sources of multimodal information and the cellular locus of this integration are unclear. We investigated the modulation of neural responses in the murine primary auditory cortical area Au1 by extrastriate visual cortex (V2). Projections from V2 to Au1 terminated in a classical descending/modulatory pattern, with highest density in layers 1, 2, 5, and 6. In brain slices, whole-cell recordings revealed long latency responses to stimulation in V2L that could modulate responses to subsequent white matter (WM) stimuli at latencies of 5-20 ms. Calcium responses imaged in Au1 cell populations showed that preceding WM with V2L stimulation modulated WM responses, with both summation and suppression observed. Modulation of WM responses was most evident for near-threshold WM stimuli. These data indicate that corticocortical projections from V2 contribute to multimodal integration in primary auditory cortex.


Figures

Figure 1.
Figure 1.
Extrastriate visual cortical axons project to Au1 in mouse. BDA was injected into V2M in vivo. (A, B) Low-magnification dark field photomicrographs of coronal sections show label (white) predominantly in superficial and deep layers of Au1. Cortical tissue margin is visible near the top of (A), running roughly parallel with the figure edge. Cortical layers 1–6 indicated on left. Orientation vane in (A) applies to panels (B) and (C) as well. Scale bar in (B) applies to both (A) and (B). (CF) Higher magnification bright field photomicrographs of darkly labeled axons in Au1 layers 1 (C) and 6 (D–F). Arrowheads in (D) and (F) indicate en passant swellings. Asterisk in (E) indicates en terminaux swelling and arrow indicates axonal branch point. Calibration bar for (D–F) in (F). (G,H) Electron photomicrographs of labeled visual cortical terminal swellings in layers 1 and 2 in Au1. Arrows indicate synaptic specializations. Asterisk in (H) indicates dendritic spine. Scale bar in (G) applies to (G) and (H).
Figure 2.
Figure 2.
BDA injection into V2M produced anterograde labeling throughout mouse auditory cortex. (A) Low-power photomicrograph of a coronal brain section showing the injection site (asterisk). Dorsal is toward the top, lateral is to the left. Scale bar = 1 mm. (B) Bottom: Camera lucida drawing of terminal swellings in Au1. Dots indicate the number of terminals in each 50 μm subdivision (dotted lines) from the surface (left) to the WM (right). Top: Plot of the number of terminals in each 50 μm subdivision. Dotted lines demarcate the boundaries of the cortical layers (roman numerals) and the WM. Note high density of labeling in superficial and deep layers. Data were derived from a vertical strip of tissue whose location is indicated by the brackets in (C), though the actual tissue used was in section adjacent to the one shown. (C) Distribution of labeled axons in camera lucida–reconstructed coronal sections. Level from bregma indicated above each section. Au1, primary auditory cortex; AuD, secondary auditory cortex, dorsal area; AuV, auditory cortex, ventral area; TeA, temporal association cortex; Ect, ectorhinal cortex.
Figure 3.
Figure 3.
BDA injection into V2L produced anterograde labeling throughout mouse auditory cortex. (A) Low-power bright field photomicrograph of a coronal section showing the injection site (asterisk). Dorsal is toward the top, lateral is to the left. Scale bar = 1 mm. (B) Camera lucida drawing of terminal swellings in Au1. Note high density of labeling in superficial and deep layers. Data were derived from a vertical strip of tissue whose location is indicated by the brackets in (C), though the actual tissue used was in section adjacent to the one shown. (C) Distribution of labeled axons in camera lucida–reconstructed coronal sections. Abbreviations as in Figure 2.
Figure 4.
Figure 4.
Biocytin injection into V2L in mouse brain slice produced anterograde labeling throughout auditory cortex. (A) Low-power bright field photomicrograph showing the injection site in V2L. Scale bar = 1 mm. (B) Higher power view of a section adjacent to (A) shows labeled cell bodies. Scale bar = 200 μm. (C) Labeled axons in camera lucida–reconstructed brain slice following injection in (A). Slices are in the off-coronal plane used in physiological and imaging experiments. Orientation vane applies to (AC). Scale bar = 500 μm. Abbreviations as in Figure 2.
Figure 5.
Figure 5.
Neural activity monitored in Au1 using Ca imaging. (A) Schematic illustration of experimental stimulation and recording arrangement in brain slice. Square indicates orientation of image in (B). Orientation vane: D, dorsal; L, lateral. (B) Fluorescence in cell bodies labeled with calcium dye OGB-1. Colored cells correspond to matching traces in (C). White cells were labeled but unresponsive. Pial surface is toward upper right. Image is 200 μm on each side. (C) Calcium traces of individual cell responses to WM stimulation at 2, 4, and 8 pulses at 40 Hz (left, middle, and right columns, respectively). Bottom gray traces show averaged neuropil response.
Figure 6.
Figure 6.
Ca responses are graded with stimulus intensity. (A) Relation between number of WM stimulus pulses in a train and Ca response. (B) Ca response in relation to WM stimulus intensity. For both (A) and (B), lines connect data collected in the same experiments. Error bars = ± 1 standard error of the mean for both (A) and (B).
Figure 7.
Figure 7.
Ca responses in Au1 neurons are triggered by action potentials. (A) Fluorescence traces and simultaneously recorded cell-attached patch signals (insets) from a layer 5 pyramidal cell in response to stimulation of WM. An increasing number of spikes fired led to graded increases in the fluorescence response, whereas there was no response in the absence of spikes (bottom traces). Each fluorescence trace is the average (thick line) of 3 trials (thin lines). In each panel, cell responses (upper traces) were corrected for responses in surrounding neuropil (lower traces). Note difference in timescales for fluorescence and electrophysiological signals. (B) Summary data across 14 cells show peak fluorescence response amplitude as a function of the number of observed spikes. Error bars correspond to ±SD. Dashed horizontal lines are average response to sham stimulation (i.e., fluorescence response in absence of stimulation). Dotted lines indicate 2SD above the sham average.
Figure 8.
Figure 8.
Ca responses in Au1 neurons are primarily synaptically mediated. (A) LFP recordings in layer 5 in response to WM stimulation (4 × 40 Hz, 100 μA) before (Ctrl), during (K Acid), and after (Recov) synaptic blockade with 4 mM kynurenic acid. (B) Corresponding fluorescence traces from experiment illustrated in (A). Responses in all but 2 of these cells were blocked (asterisks), and the effect reversed within 20 min (right column). Traces at bottom illustrate neuropil response. (C) Summary data from 8 experiments using either kynurenic acid (n = 4) or 6-cyano-7-nitroquinoxaline-2,3-dione/(2R)-amino-5-phosphonovaleric acid (n = 4) to block excitatory synaptic transmission in response to WM stimulation (68 cells) and from 7 experiments using 6-cyano-7-nitroquinoxaline-2,3-dione/(2R)-amino-5-phosphonovaleric acid to block responses to V2L stimulation (28 cells). Error bars are SD. Horizontal lines are mean of sham analysis (dashed line, i.e., responses detection algorithm run on data segments in which no stimulus was applied) and sham mean + 2SD (solid line).
Figure 9.
Figure 9.
Intracellular recordings from cells responsive to V2 and WM stimulation. (A) Responses from a regular spiking layer 3 pyramidal cell to polarizing current pulses (i), WM (ii), and V2 stimulation (iii). In (ii) and (iii), the cell was held at potentials positive and negative to rest to test for the presence of a disynaptic inhibitory component, which was observed for WM (black arrow) but not V2L stimulation. (B) Responses of a fast-spiking (putatively inhibitory) cell to polarizing current pulses (i), WM (ii), and V2L stimulation (iii). In (ii) and (iii), single trials are shown in gray and average responses are shown in black. (C) Recording from the same cell as in (A). Here, preceding activation of V2L (arrow) renders WM stimulation (triangles) superthreshold at specific delays. Responses are the average of 10 trials. (D) Spike probability as a function of V2 delay for the data in (C). Positive delays correspond to V2L stimulation preceding WM stimulation.
Figure 10.
Figure 10.
Modulation of Ca responses to WM stimuli by V2. (A) Cartoon of a brain slice showing experimental preparation. The square (200 × 200 μm) indicates the approximate area that was imaged in (B). Stimulating electrodes were placed in V2L and in the WM. (B) Fluorescence traces recorded from 45 cells in response to stimulation in the WM (left column; 125 μA, 10 pulses at 40 Hz), V2L (middle column; 250 μA, 10 pulses at 40 Hz), or both (right column; V2L stimulus train preceded WM stimulus train by 25 ms). Stimuli were applied at times indicated by arrowheads. Note that some cells responded to paired stimulation when they showed no response to either WM or V2L stimulus in isolation (asterisks), while other cells showed greatly facilitated responses to paired stimulation (diamonds).
Figure 11.
Figure 11.
Ca responses to WM stimulation can be facilitated or suppressed by V2 stimulation. Fluorescence traces recorded simultaneously from 4 representative cells in Au1 in response to WM (left; 100 μA, 4 pulses at 40 Hz), V2L (middle; 200 μA, 4 pulses at 40 Hz), and paired (right; V2L and WM stimulus trains interleaved, V2L stimuli preceded WM stimuli by 25 ms) stimulation. “Dark traces” are averages of 3 trials (gray traces). All 4 cells exhibit responses to WM stimulation (small response in third cell is marked by arrow). None exhibited responses to V2L stimulation but with paired stimulation WM responses in top 3 cells were modulated: 2 were facilitated (cells 1 and 2) and 1 was suppressed (cell 3). The bottom cell was unaffected. All comparisons via Student's t-tests with significance criterion P < 0.05.
Figure 12.
Figure 12.
Facilitation by V2 stimulation is more effective for small WM responses. (A) Fluorescence traces recorded from 4 representative cells simultaneously in Au1 in response to WM (first and third columns), paired V2L–WM (second and fourth columns) stimulation for 2 different WM stimulation intensities: 75 μA (first and second columns) and 100 μA (third and fourth columns). V2L stimulation intensity was identical in both cases (200 μA). Four pulses each were applied to WM and V2L, at 0 ms delay. Note that for the lower WM stimulation intensity, all 4 cells exhibit facilitation in response to paired stimulation, but for the higher WM stimulation intensity, this is true only for cells 1 and 2. (B) Summary of all recordings from the experiment in (A) (mean ± standard error of the mean; n = 30 cells) showing the difference between response amplitude (%ΔF/F) to paired stimulation versus WM alone. Note greater facilitation (i.e., greater difference) for smaller WM stimulation intensity.
Figure 13.
Figure 13.
Summary of effects of V2 stimulation on WM responses. (A) Statistical analysis of responses to determine cells whose WM responses were significantly affected by preceding V2L stimulus. The data distribution (solid line) consists of the ratio of mean paired to mean WM response amplitude in all cells with detected responses to WM, V2L, or paired stimulation (n = 1417 cells). Ratio values near unity arise from cells with no significant difference between paired and WM alone. Ratio values in the tails of the distribution arise from cells with significant differences. To distinguish between these 2 populations in the data distribution, a null distribution (dotted line) was created from the WM-alone responses and a local false discovery rate analysis was used to determine which values of the ratio were significantly different from unity (gray filled area). (B) Each point represents the difference between the responses to paired stimulation and WM alone (RPrRWM) plotted versus the amplitude of the WM response (RWM) in a single cell. Zero difference indicates no effect of V2L stimulation. Values <0 indicate suppression of WM response by preceding V2L stimulation, while values >0 indicate summation, due to either enhancement of WM response (in the absence of response to V2L alone) or additive effects of V2L and WM responses. (C) RPrRWM plotted versus the amplitude of the V2L response (RV2L) in the same cell, for the same population of cells as in (A). Values below the horizontal line (RPrRWM = 0) indicate suppression and those above the line indicate summation. The identity line indicates linear summation. Values above the identity line indicate superlinear summation, while values below the line indicate sublinear summation. For panels (B) and (C), cells whose paired responses were significantly different from WM responses by the analysis of panel (A) are marked with “black circles.” All other cells are marked with “gray circles.” (D) Cumulative amplitude plots for the data in (B) and (C). All cells, both those whose WM responses were significantly affected by V2L stimulation and those that were not, are included. The increasing difference between the paired and WM curves at low WM response amplitude reflects the tendency of V2L stimulation to have the greatest effect on small-amplitude WM responses. Numbers below the WM curve indicate at what point in the distribution of cells the indicated WM response amplitude occurred. In all panels, only cells with responses of ΔF/F > 0.78 % to WM, V2L, and/or paired stimulation were included.

References

    1. Adams JC. Heavy metal intensification of DAB-based HRP reaction product. J Histochem Cytochem. 1981;29(6):775. - PubMed
    1. Arnault P, Roger M. Ventral temporal cortex in the rat: connections of secondary auditory areas Te2 and Te3. J Comp Neurol. 1990;302(1):110–123. - PubMed
    1. Bar M. The proactive brain: memory for predictions. Philos Trans R Soc Lond B Biol Sci. 2009;364(1521):1235–1243. - PMC - PubMed
    1. Bizley JK, Nodal FR, Bajo VM, Nelken I, King AJ. Physiological and anatomical evidence for multisensory interactions in auditory cortex. Cereb Cortex. 2007;17(9):2172–2189. - PMC - PubMed
    1. Budinger E, Heil P, Hess A, Scheich H. Multisensory processing via early cortical stages: connections of the primary auditory cortical field with other sensory systems. Neuroscience. 2006;143(4):1065–1083. - PubMed

Publication types