

Blood-cerebrospinal fluid barrier permeability in Alzheimer's disease
- PMID: 21471645
- PMCID: PMC3139450
- DOI: 10.3233/JAD-2011-101959
Blood-cerebrospinal fluid barrier permeability in Alzheimer's disease
Abstract
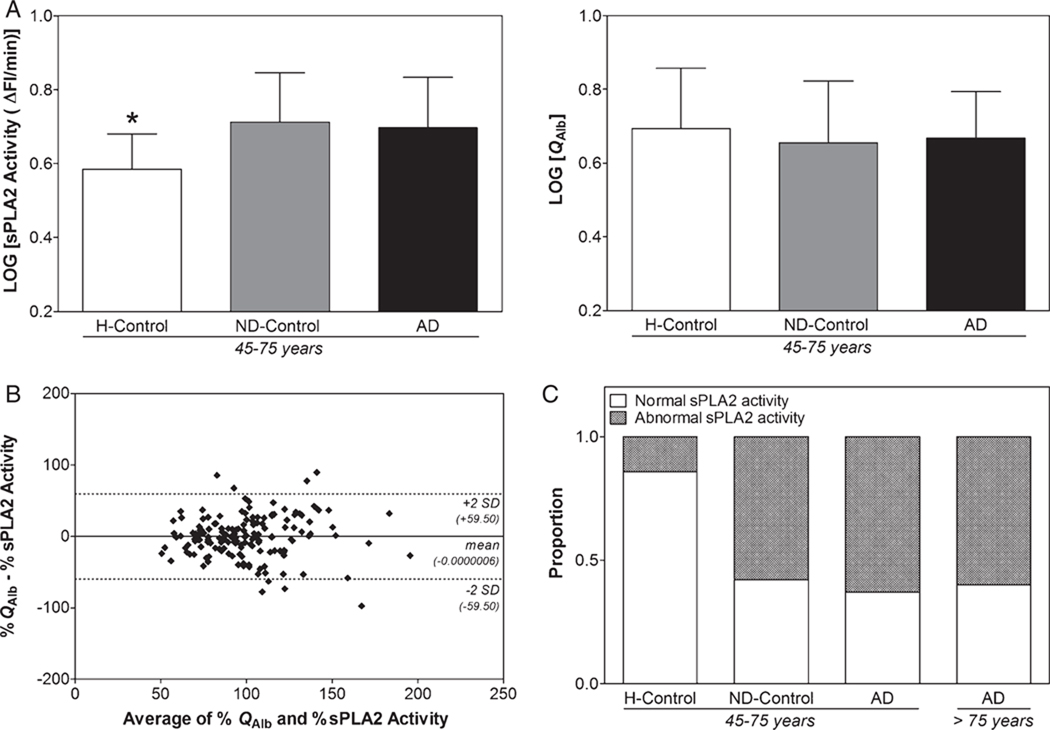
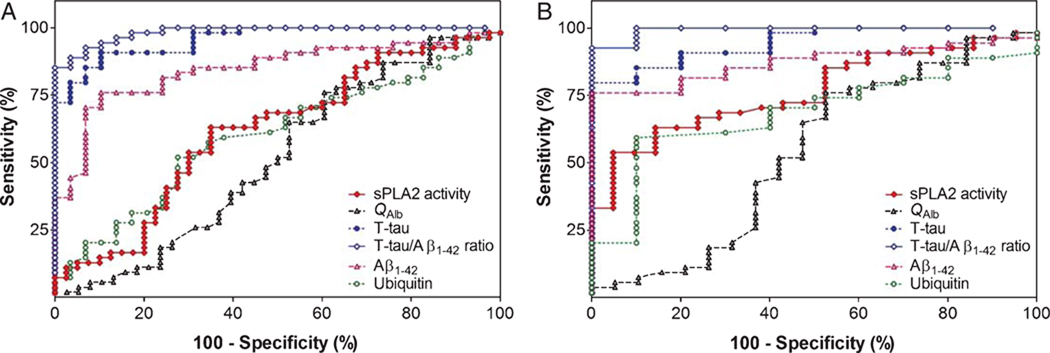
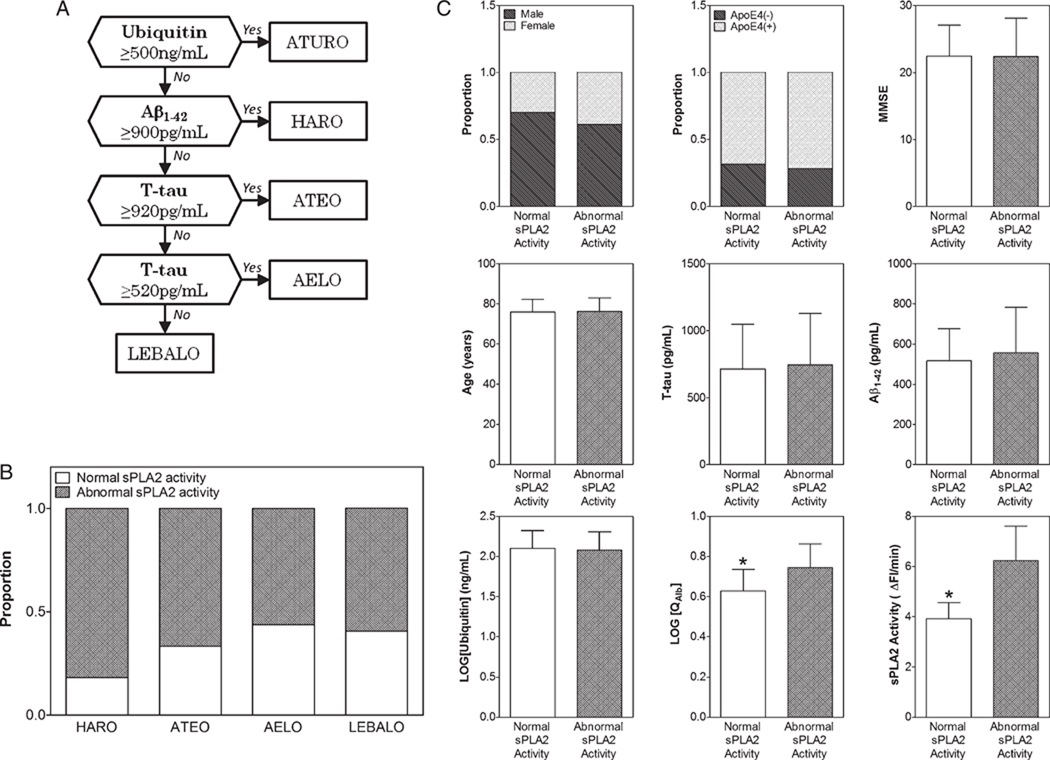
The role of blood-cerebrospinal fluid barrier (BCB) dysfunction in Alzheimer's disease (AD) has been addressed but not yet established. We evaluated the BCB integrity in 179 samples of cerebrospinal fluid (CSF) retrospectively collected from AD patients and control cases using both CSF/serum albumin ratio (QAlb) and CSF secretory Ca2+-dependent phospholipase A2 (sPLA2) activity. These analyses were supplemented with the measurement of total tau, amyloid-β1-42 (Aβ1-42), and ubiquitin CSF levels. We found that due to its higher sensitivity, CSF sPLA2 activity could 1) discriminate AD from healthy controls and 2) showed BCB impairment in neurological control cases while QAlb could not. Moreover, the CSF sPLA2 activity measurement showed that around half of the AD patients were characterized by a BCB impairment. The BCB dysfunction observed in AD was independent from Mini-Mental State Examination score as well as CSF levels of total tau, Aβ1-42, and ubiquitin. Finally, the BCB dysfunction was not limited to any of the CSF biomarkers-based previously identified subgroups of AD. These results suggest that the BCB damage occurs independent of and probably precedes both Aβ and tau pathologies in a restricted subgroup of AD patients.
Figures
Similar articles
-
Cerebrospinal fluid secretory Ca2+-dependent phospholipase A2 activity: a biomarker of blood-cerebrospinal fluid barrier permeability.Neurosci Lett. 2010 Jul 12;478(3):179-83. doi: 10.1016/j.neulet.2010.05.012. Epub 2010 May 12. Neurosci Lett. 2010. PMID: 20470866 Free PMC article.
-
Effect of Vascular Risk Factors on Blood-Brain Barrier and Cerebrospinal Fluid Biomarkers Along the Alzheimer's Disease Continuum: A Retrospective Observational Study.J Alzheimers Dis. 2024;97(2):599-607. doi: 10.3233/JAD-230792. J Alzheimers Dis. 2024. PMID: 38160356
-
Blood-cerebrospinal fluid barrier dysfunction for high molecular weight proteins in Alzheimer disease and major depression: indication for disease subsets.Alzheimer Dis Assoc Disord. 1997 Jun;11(2):78-87. doi: 10.1097/00002093-199706000-00004. Alzheimer Dis Assoc Disord. 1997. PMID: 9194954
-
CSF evidence of pericyte damage in Alzheimer's disease is associated with markers of blood-brain barrier dysfunction and disease pathology.Alzheimers Res Ther. 2019 Sep 14;11(1):81. doi: 10.1186/s13195-019-0534-8. Alzheimers Res Ther. 2019. PMID: 31521199 Free PMC article.
-
Clinical indications for analysis of Alzheimer's disease CSF biomarkers.Rev Neurol (Paris). 2013 Oct;169(10):709-14. doi: 10.1016/j.neurol.2013.07.024. Epub 2013 Sep 6. Rev Neurol (Paris). 2013. PMID: 24016466 Review.
Cited by
-
Visinin-like protein 1 levels in blood and CSF as emerging markers for Alzheimer's and other neurodegenerative diseases.Alzheimers Res Ther. 2022 Nov 22;14(1):175. doi: 10.1186/s13195-022-01122-4. Alzheimers Res Ther. 2022. PMID: 36419075 Free PMC article.
-
Blood-brain barrier leakage in Alzheimer's disease: From discovery to clinical relevance.Pharmacol Ther. 2022 Jun;234:108119. doi: 10.1016/j.pharmthera.2022.108119. Epub 2022 Jan 30. Pharmacol Ther. 2022. PMID: 35108575 Free PMC article. Review.
-
Fluid biomarkers for diagnosing dementia: rationale and the Canadian Consensus on Diagnosis and Treatment of Dementia recommendations for Canadian physicians.Alzheimers Res Ther. 2013 Nov 25;5(Suppl 1):S8. doi: 10.1186/alzrt223. Epub 2013 Nov 25. Alzheimers Res Ther. 2013. PMID: 24565514 Free PMC article.
-
A novel phospholipase A2 (D49) from the venom of the Crotalus oreganus abyssus (North American Grand canyon rattlesnake).Biomed Res Int. 2014;2014:654170. doi: 10.1155/2014/654170. Epub 2014 Feb 24. Biomed Res Int. 2014. PMID: 24707493 Free PMC article.
-
Effects of running on adiponectin, insulin and cytokines in cerebrospinal fluid in healthy young individuals.Sci Rep. 2019 Feb 13;9(1):1959. doi: 10.1038/s41598-018-38201-2. Sci Rep. 2019. PMID: 30760755 Free PMC article.
References
-
- Choi YK, Kim KW. Blood-neural barrier: its diversity and coordinated cell-to-cell communication. BMB Rep. 2008;41:345–352. - PubMed
-
- Stolp HB, Dziegielewska KM. Review: Role of developmental inflammation and blood-brain barrier dysfunction in neurodevelopmental and neurodegenerative diseases. Neuropathol Appl Neurobiol. 2009;35:132–146. - PubMed
-
- Farrall AJ, Wardlaw JM. Blood-brain barrier: ageing and microvascular disease – systematic review and meta-analysis. Neurobiol Aging. 2009;30:337–352. - PubMed
-
- Wang H, Golob EJ, Su MY. Vascular volume and blood-brain barrier permeability measured by dynamic contrast enhanced MRI in hippocampus and cerebellum of patients with MCI and normal controls. J Magn Reson Imaging. 2006;24:695–700. - PubMed
Publication types
MeSH terms
Substances
Grants and funding
LinkOut - more resources
Full Text Sources
Other Literature Sources
Medical
Miscellaneous
