. 2011 Jul;7(7):727-36.
doi: 10.4161/auto.7.7.15371. Epub 2011 Jul 1.

Liver autophagy contributes to the maintenance of blood glucose and amino acid levels

Affiliations

Liver autophagy contributes to the maintenance of blood glucose and amino acid levels

Junji Ezaki et al. Autophagy. 2011 Jul.

Abstract

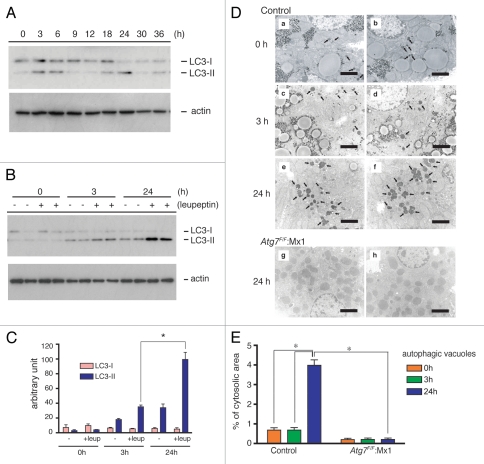
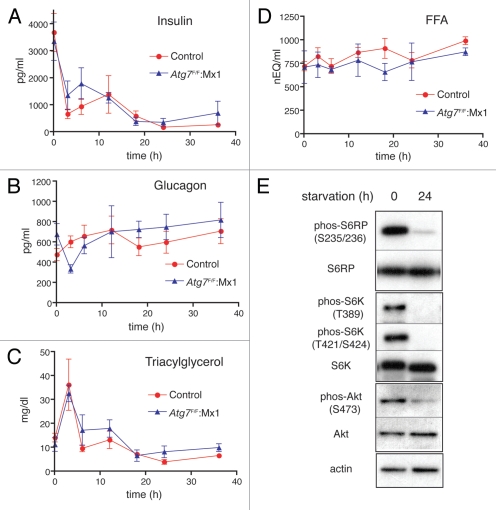
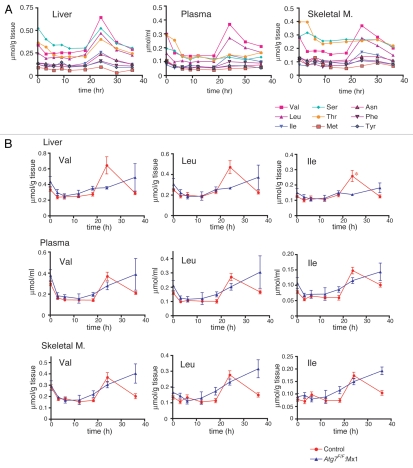
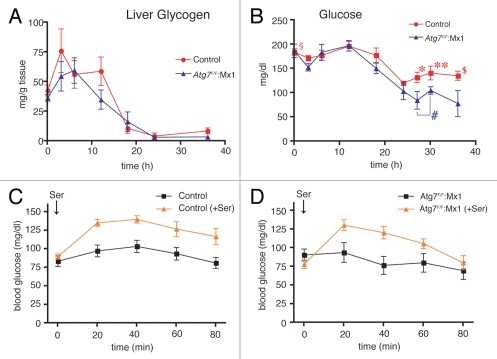
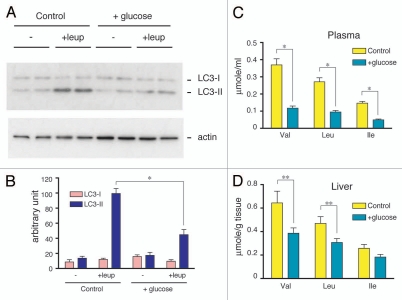
Both anabolism and catabolism of the amino acids released by starvation-induced autophagy are essential for cell survival, but their actual metabolic contributions in adult animals are poorly understood. Herein, we report that, in mice, liver autophagy makes a significant contribution to the maintenance of blood glucose by converting amino acids to glucose via gluconeogenesis. Under a synchronous fasting-initiation regimen, autophagy was induced concomitantly with a fall in plasma insulin in the presence of stable glucagon levels, resulting in a robust amino acid release. In liver-specific autophagy (Atg7)-deficient mice, no amino acid release occurred and blood glucose levels continued to decrease in contrast to those of wild-type mice. Administration of serine (30 mg/animal) exerted a comparable effect, raising the blood glucose levels in both control wild-type and mutant mice under starvation. Thus, the absence of the amino acids that were released by autophagic proteolysis is a major reason for a decrease in blood glucose. Autophagic amino acid release in control wild-type livers was significantly suppressed by the prior administration of glucose, which elicited a prompt increase in plasma insulin levels. This indicates that insulin plays a dominant role over glucagon in controlling liver autophagy. These results are the first to show that liver-specific autophagy plays a role in blood glucose regulation.


Figures

Figure 1
Figure 1
Starvation-dependent changes in LC3-II levels and autophagic vacuoles in wild-type livers. (A and B) Postnuclear supernatants of the livers (10 µg protein) isolated from mice starved for the indicated periods were analyzed by immunoblotting analysis. (A) LC3-1 and LC3-II in the livers of starved mice without leupeptin administration. LC3-I, soluble form; LC3-II, PE -conjugated form. (B) LC3-1 and LC3-II in the livers of leupeptin-treated, starved mice. Leupeptin was injected as described in Materials and Methods. The data are representative of three separate experiments. (C) Densitometric analyses of LC3-I and LC3-II levels between leupeptin-administered (+leup) and nonadministered (−) livers isolated from nonstarved (0 h), 3 h and 24 h starved mice. Each value is the mean ± SEM of data from at least three mice. *p < 0.005. (D) Electron micrographs of liver samples isolated from wild-type mice starved for 0 h (a and b), 3 h (c and d) and 24 h (e and f), respectively and liver-specific Atg7-deficient mice starved for 24 h (e and h). All mice were administered leupeptin 1 h before dissection. Note that the autophagic vacuoles (arrows in a–f) markedly increased in 24-h starved wild-type mice (e and f) compared with 0 h and 3 h starved wild-type mice (a–d). Autophagic vacuoles were not detected in Atg7-deficient mouse livers starved for 24 h (g and h). Bars, 2 µm. (E) The volume density (%) of autophagic vacuoles in the cytoplasmic area was calculated as described in the Methods. Each value is the mean ± SEM of 40 parts. *p < 0.001.
Figure 2
Figure 2
Changes in plasma insulin, glucagon, triacylglycerol and free fatty acids in wild-type and Atg7-deficient mice during starvation. At the times indicated after initiation of starvation, plasma samples were taken from wild-type (red circle) and Atg7-deficient (blue triangle) mice and the concentrations of insulin (A), glucagon (B), triacylglycerol (C) and free fatty acids (D, FFA) were determined. Note that insulin fell to its lowest level after a 24 h starvation period. Each value is the mean ± SEM of data from at least three mice. (E) Phosphorylated states of S6 ribosomal protein, p70 S6 kinase and Akt in nonstarved and 24 h starved wild-type livers. Postnuclear supernatants isolated from non-starved and 24 h starved mice were subjected to immunoblotting using antibodies specific for phosphorylated S6 ribosomal protein [phos-S6RP (S235/236)], S6 ribosomal protein (S6RP), phopsphorylated P70 S6 kinase [phos-S6K (T389) and phos-S6K (T421/S424)], P70 S6 kinase (S6K), phosphorylated Akt [phos-Akt (S473)], Akt and actin, respectively. The same pattern was also confirmed with Atg7-deficient livers before and after starvation.
Figure 3
Figure 3
Transient increase in free amino acids in the liver, plasma and skeletal muscle during starvation. (A) Plasma and tissue samples were collected from control wild-type mice starved for the indicated periods and were processed for amino acid analyses as described in Materials and Methods. The concentrations of nine amino acids, including the BCAAs, are expressed as µmol/g wet tissue (liver and skeletal muscles) or µmol/ml of plasma. (B) Comparison of time-dependent changes in BCAA concentrations between wild-type liver (red circle) and Atg7-deficient liver (blue triangle) during starvation. BCAA of liver, plasma and skeletal muscle taken from control and liver-specific Atg7-deficient mice at the indicated times during starvation were determined. Each value is the mean ± SEM of data from at least three mice.
Figure 4
Figure 4
Activation of liver gluconeogenesis in association with starvation-induced autophagic protein degradation. Changes in liver glycogen levels (A) and plasma glucose concentration (B) were determined. At various times after starvation, liver and blood samples were taken from wild-type (red circle) and liver-specific conditional Atg7-deficient mice (blue triangle). Each value is the mean ± SEM of data from at least three mice. Numbers of mice used were: wild-type mice starved for 0 (n = 10), 3 (n = 11), 6 (n = 7), 12 (n = 7), 18 (n = 7), 24 (n = 5), 27 (n = 10), 30 (n = 6) and 36 h (n = 10), respectively and liver-specific Atg7-deficient mice starved for 0 (n = 7), 3 (n = 5), 6 (n = 3), 12 (n = 3), 18 (n = 3), 24 (n = 4), 27 (n = 5), 30 (n = 9) and 36 h (n = 3), respectively. The statistical significance and insignificance in the differences between wild-type and mutant mice at 0 (§p = 0.854), 27 (*p = 0.0340), 30 (**p = 0.0311) and 36 ($p = 0.0238) h of starvation and the statistical insignificance (#p = 0.482) in the plasma glucose levels of liver-specific Atg7-deficient mice between two periods of starvation (27 and 30 h) are shown. (C and D) Recovery of blood glucose concentration by oral administration of a glucogenic amino acid, serine. Wild-type (C) and liver-specific Atg7-deficient mice (D) starved for 24 h were orally administered serine (30 mg) at 24 h of starvation and blood glucose concentration was determined with a glucometer for the subsequent 80 min as described in Materials and Methods. Each value is the mean ± SEM of data. Wild-type (no treatment; n = 12, serine administered; n = 14) (C) and liver-specific Atg7-deficient mice (no treatment; n = 6, serine administered; n = 8) were examined. As total blood was used for the determination, the glucose level was significantly lower than the plasma glucose level determined in (B).
Figure 5
Figure 5
Suppression of the amino acid surge by glucose administration. (A) Suppression of leupeptin-induced accumulation of LC3-II by glucose administration. Wild-type mice were orally administered 0.2 g of an aqueous glucose solution or tap water as a control after 18 and 21 h of starvation. Then, leupeptin was injected intraperitoneally into mice after 23 h of starvation. Plasma and livers were collected from 24 h starved mice. Postnuclear supernatants (10 µg protein) of the livers were subjected to immunoblotting analysis. The data shown are representative of three separate preparations. (B) Quantitative densitometry of endogenous LC3-I and LC3-II levels in postnuclear supernatants of livers from control or glucose-administered mice with or without leupeptin treatment. The data are means ± SEM of at least three different preparations. (C and D) Effect of glucose administration on the BCAA concentration in the plasma (C) and liver (D) were analyzed using an amino acid analyzer, as described in Materials and Methods. Each value is the mean ± SEM of data from four mice. *p < 0.001, **p < 0.05.

References

    1. Mizushima N. Autophagy: process and function. Genes Dev. 2007;21:2861–2873. - PubMed
    1. Xie Z, Klionsky DJ. Autophagosome formation: core machinery and adaptations. Nat Cell Biol. 2007;9:1102–1109. - PubMed
    1. Mizushima N, Levine B, Cuervo AM, Klionsky DJ. Autophagy fights disease through cellular self-digestion. Nature. 2008;451:1069–1075. - PMC - PubMed
    1. Amano A, Nakagawa I, Yoshimori T. Autophagy in innate immunity against intracellular bacteria. J Biochem. 2006;140:161–166. - PubMed
    1. Komatsu M, Ueno T, Waguri S, Uchiyama Y, Kominami E, Tanaka K. Constitutive autophagy: vital role in clearance of unfavorable proteins in neurons. Cell Death Differ. 2007;14:887–894. - PubMed

Publication types