. 2011 Mar 22:5:1.
doi: 10.3389/fninf.2011.00001. eCollection 2011.

Splash: a software tool for stereotactic planning of recording chamber placement and electrode trajectories

Affiliations

Splash: a software tool for stereotactic planning of recording chamber placement and electrode trajectories

Daniel J Sperka et al. Front Neuroinform. .

Abstract

While computer-aided planning of human neurosurgeries is becoming more and more common, animal researchers still largely rely on paper atlases for planning their approach before implanting recording chambers to perform invasive recordings of neural activity, which makes this planning process tedious and error-prone. Here we present SPLASh (Stereotactic PLAnning Software), an interactive software tool for the stereotactic planning of recording chamber placement and electrode trajectories. SPLASh has been developed for monkey cortical recordings and relies on a combination of structural MRIs and electronic brain atlases. Since SPLASh is based on the neuroanatomy software Caret, it should also be possible to use it for other parts of the brain or other species for which Caret atlases are available. The tool allows the user to interactively evaluate different possible placements of recording chambers and to simulate electrode trajectories.

Keywords: electrode trajectories; monkey; recording chamber; software; stereotactic coordinates.


Figures

Figure 1
Figure 1
Surface information that has been extracted from the MRI. Looking through the outer skull surface (cyan) one can see the outer brain surface (white).
Figure 2
Figure 2
Coordinate system and recording chamber orientation. (A) Stereotactic coordinate system: the X axis extends from left to right, the Y axis from posterior to anterior, and the Z axis from ventral to dorsal. The axes intersect at the origin of the coordinate system. (B) Recording chamber with a positive elevation angle. The orientation of the central axis of the recording chamber is indicated by the yellow vector. Note that the axes represent a translated coordinate system. The Y and Z axes and the central axis of the recording chamber intersect at the location of the target node. (C) Recording chamber with a negative elevation angle. (D) Recording chamber with a positive tilt angle. (E) Recording chamber with a negative tilt angle.
Figure 3
Figure 3
Target selection and default recording chamber placement. The left panel shows a flattened map of the cortical sheet. Identified cortical areas are superimposed in color (Lewis and Van Essen, 2000) with some of them being labeled. A central location in area MT (red in the map) has been selected as the target (filled green square). The corresponding location is also shown in the structural MRI on the right side with the cross-hair cursors. The central panel on the gray background shows the cortical hemisphere in 3D (with identified areas again being marked in color), a circular part of the outer skull surface (light gray), and a recording chamber (blue) that has been placed according to SPLASh's default placement algorithm.
Figure 4
Figure 4
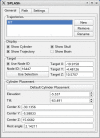
Main SPLASh user interface. The “Target” section contains information about the stereotactic location of the recording target. The “Cylinder Placement” section contains information about the stereotactic location and the orientation of the recording chamber.
Figure 5
Figure 5
Visualization of all parts of the brain that can be accessed with the default recording chamber placement. The left panel shows all accessible nodes marked in white on the flattened representation of the cortical sheet. Likewise, all accessible nodes are marked in red on the MRI on the right side.
Figure 6
Figure 6
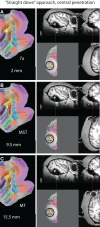
Visualization of all parts of the brain that can be accessed with an alternative “straight down” approach (elevation and tilt of zero).
Figure 7
Figure 7
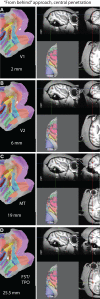
Visualization of all parts of the brain that can be accessed with an approach “from behind” (symmetry axis parallel to sagittal plane and 20° above horizontal; elevation of −70° and tilt of zero).
Figure 8
Figure 8
Control interface for simulating electrode trajectories. From top to bottom: “Path radius” defines the maximum distance of visualized nodes from the virtual electrode. “Use Depth Tool” visualizes only nodes near the “tip” of the virtual electrode by constraining the depth. Only nodes whose depth does not deviate more than “Depth tool tolerance” are marked. Depth is measured along the virtual electrode track with zero depth being defined as the intersection of the electrode track with the outer brain surface. The virtual electrode is advanced by moving the slider below “Depth tool tolerance.” The current depth is indicated to the right of the slider and the search results are updated in real-time. “Grid orientation” allows specifying electrode locations relative to the center of the recording chamber in a coordinate system that is rotated with respect to the default coordinate system (see Materials and Methods). The electrode location is specified by clicking on one of the red and blue grid points.
Figure 9
Figure 9
A virtual electrode trajectory along the symmetry axis of the default placement. (A) Hitting V4 at a depth of 2 mm. White nodes on the flat map as well as red nodes on the MRI indicate locations surrounding the virtual electrode tip. The MRI slices intersect at the location of the electrode tip, also marked by the cross-hair cursors. (B) Hitting a different part of V4 at a depth of 5 mm. (C) Hitting MT at a depth of 10 mm. Note that the MRI slices are being updated as the virtual electrode is advanced.
Figure 10
Figure 10
A virtual electrode trajectory along the symmetry axis of the “straight down” approach (elevation and tilt of zero). (A) Hitting area 7a at a depth of 2 mm. (B) Hitting MST at a depth of 9.5 mm. (C) Hitting MT at a depth of 15.5 mm.
Figure 11
Figure 11
A virtual electrode trajectory along the symmetry axis of the “from behind” approach (elevation of −70° and tilt of zero). (A) Hitting V1 at a depth of 2 mm. (B) Hitting V2 at a depth of 6 mm. (C) Hitting MT at a depth of 19 mm. (D) Hitting FST/TPO at a depth of 25.5 mm.
Figure 12
Figure 12
Eccentric virtual electrode tracks when using the default placement. (A) A virtual electrode placed 5 mm to the left of the center of the recording chamber hitting V4 at a depth of 5 mm and (B) MT at a depth of 10 mm. (C) A virtual electrode placed 5 mm to the right of the center of the recording chamber hitting V4/MST at a depth of 4 mm, (D) MT/MST at a depth of 8 mm, and (E) MST at a depth of 13 mm. Note that different parts of MT are accessed when choosing different electrode locations.
Figure 13
Figure 13
An approach giving access to different parts of a cortical area (in this case MT) with all central penetrations. The elevation (−25°) and tilt (+30°) angles have been adjusted interactively such that the white nodes on the flat map (left side), representing nodes that can be accessed with central penetrations, cover most of the cortical area of interest (in this case MT, shown in red with the green square representing the target location).

Similar articles

Cited by

References

    1. Baker J., Vytlacil J., Reid E., Van Essen D. (2008). Using Caret to guide single unit physiology. Available at: http://sumsdb.wustl.edu/sums/directory.do?id=6526890&dir_name=MAP_RECORD...
    1. Cox R. W. (1996). AFNI: software for analysis and visualization of functional magnetic resonance neuroimages. Comput. Biomed. Res. 29, 162–173 - PubMed
    1. Desimone R., Ungerleider L. G. (1986). Multiple visual areas in the caudal superior temporal sulcus of the macaque. J. Comp. Neurol. 248, 164–189 - PMC - PubMed
    1. Kalwani R. M., Bloy L., Elliott M. A., Gold J. I. (2009). A method for localizing microelectrode trajectories in the macaque brain using MRI. J. Neurosci. Methods 176, 104–111 - PMC - PubMed
    1. Lewis J. W., Van Essen D. C. (2000). Mapping of architectonic subdivisions in the macaque monkey, with emphasis on parieto-occipital cortex. J. Comp. Neurol. 428, 79–111 - PubMed