. 2011 Aug;26(8):1913-25.
doi: 10.1002/jbmr.400.

Nucleosides accelerate inflammatory osteolysis, acting as distinct innate immune activators

Affiliations

Nucleosides accelerate inflammatory osteolysis, acting as distinct innate immune activators

George Pan et al. J Bone Miner Res. 2011 Aug.

Abstract

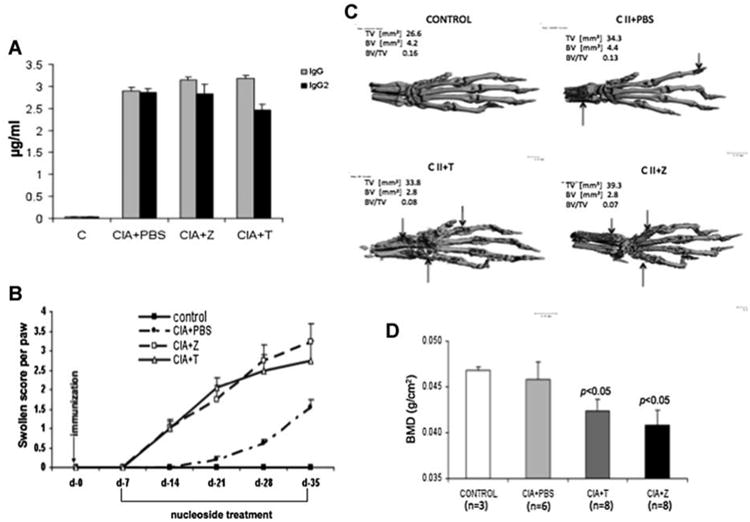
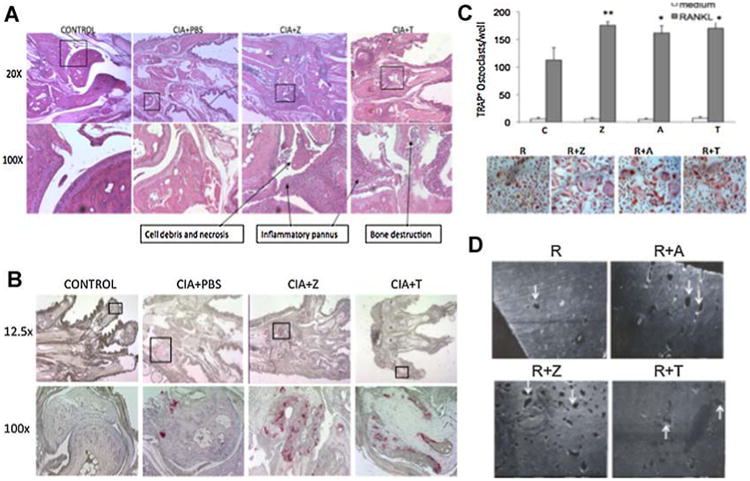
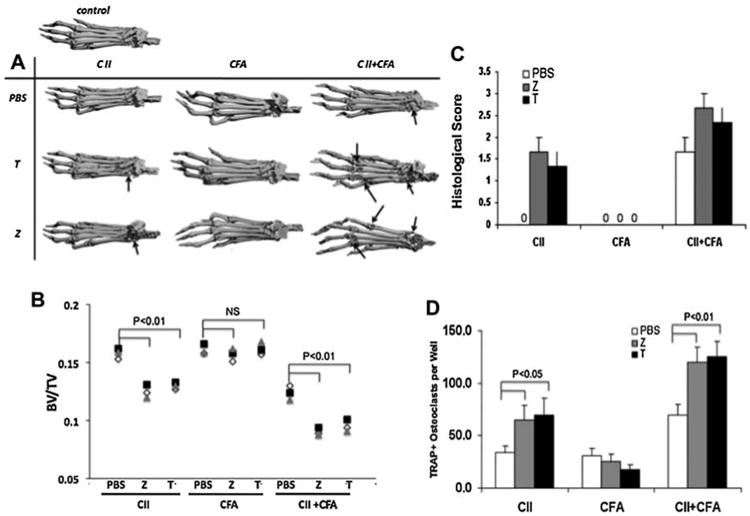
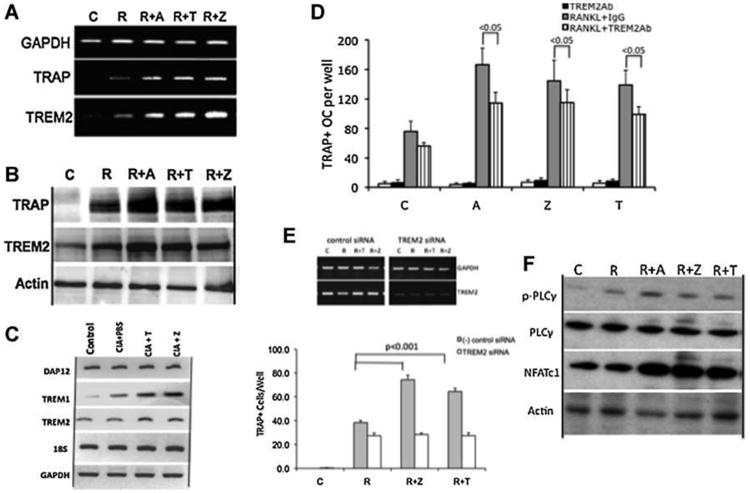
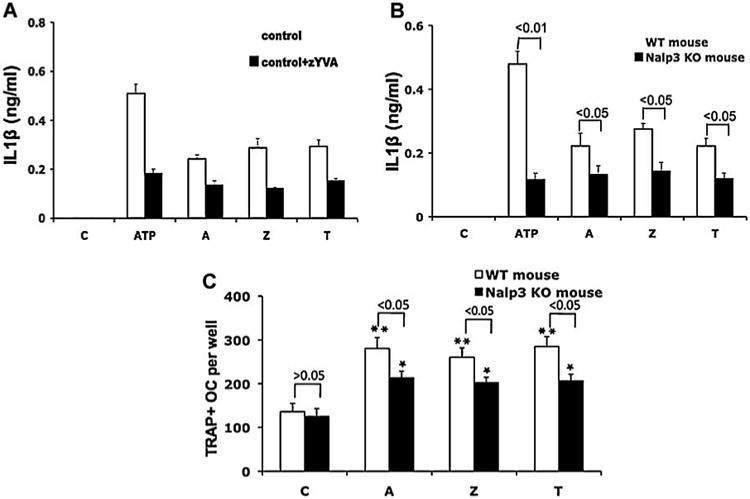
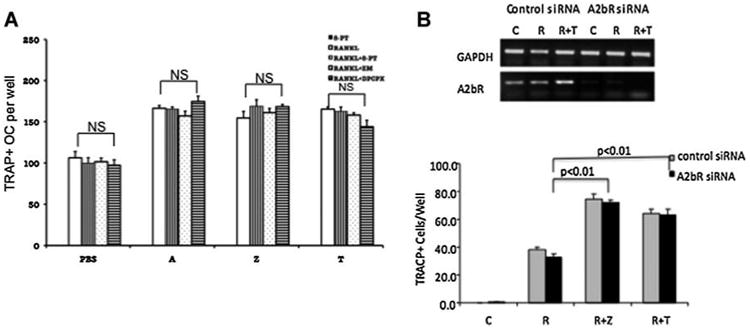
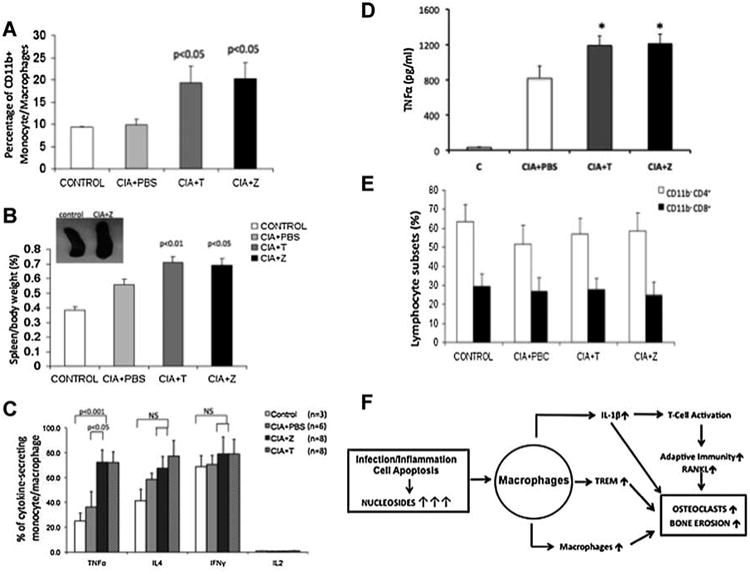
The innate immune system and its components play an important role in the pathogenesis of inflammatory bone destruction. Blockade of inflammatory cytokines does not completely arrest bone erosion, suggesting that other mediators also may be involved in osteolysis. Previously we showed that nucleosides promote osteoclastogenesis and bone-resorption activity in the presence of receptor activator for nuclear factor κB ligand (RANKL) in vitro. The studies described here further demonstrate that selected nucleosides and nucleoside analogues accelerate bone destruction in mice immunized with collagen II alone (CII) but also further enhance bone erosion in mice immunized by collagen II plus complete Freund's adjuvant (CII + CFA). Abundant osteoclasts are accumulated in destructive joints. These data indicate that nucleosides act as innate immune activators distinct from CFA, synergistically accelerating osteoclast formation and inflammatory osteolysis. The potential roles of the surface triggering receptor expressed on myeloid cells (TREM) and the intracellular inflammasome in nucleoside-enhanced osteoclastogenesis have been studied. These observations provide new insight into the pathogenesis and underlying mechanism of bone destruction in inflammatory autoimmune osteoarthritis.


Conflict of interest statement

Disclosures: GP, RZ, DAG, and PS are employees of Emory University. PY, YL, JPC, JL, XF, and JMMcD are employees of the University of Alabama at Birmingham. All the authors state that they have no conflicts of interest.

Figures

Fig. 1
Fig. 1
Nucleosides accelerate inflammation and osteolysis in CIA mice. Arthritis was induced in DBA-1 mice by immunization with collagen II and complete Freund's adjuvant, as described previously.(11) One week after immunization (day 7), mice were injected intraperitoneally with PBS (CIA + PBS, n = 6) or with thymidine (CIA + T, n = 8) or azidothymidine (CIA + Z, n = 8) (25 mg/kg/200 μL PBS/mouse) daily for 5 days per week. Nucleosides were administrated for 4 weeks. Nonimmunized DBA1 mice were used as controls (Control, n = 3). Mice were euthanized on day 35, and the following tests were performed. (A) The level of bovine collagen type II antibodies in mouse serum samples was determined quantitatively by ELISA. The results are expressed as the mean ± SEM. (B) The severity of inflammatory arthritis was assessed by scoring the degree of paw swelling. For each mouse, the mean score per paw (maximum value = 4) was calculated. Data are the mean swelling score/paw ± SEM for each group. (C) The hind limbs were scanned horizontally by μCT. The parameters of total volume (TV), bone volume (BV), and ratio of BV to TV (BV/TV) are shown, and the figures are a representative image of each experimental group of mice. (D) Noncephalic whole-body bone mineral density (BMD) of mice was measured using dual-energy X-ray absorptiometry (DXA). The results are expressed as the mean ±SEM. The p values are shown compared with control.
Fig. 2
Fig. 2
Nucleosides stimulate osteoclastogenesis and bone resorption in vivo and in vitro. (A) Decalcified paraffin-embedded 2-μm sections of the paws were stained with hematoxylin and eosin for assessing signs of inflammation and bone destruction (arrows). Representative micrographs are shown. (B) TRACP staining was performed to detect TRACP+ osteoclasts. Representative TRACP staining of paw in collagen II–immunized mice treated with nucleosides is shown. TRACP+ osteoclasts are purple. (C) Mouse bone marrow macrophages were incubated without and with nucleosides, azidothymidine (Z), adenosine (A), or thymidine (T) at 10 μM in the absence (medium) and presence of RANKL (RANKL, 100 ng/mL) plus M-CSF (10 ng/mL) for 4 more days. TRACP staining was performed, and TRACP+ osteoclasts with up to 3 nuclei were counted per well. The values are presented as the mean TRACP+ osteoclasts per well±SE. Representative TRACP+ osteoclast cells are shown from four individual experiments. *p<.05 and **p < .01 for RANKL plus nucleosides versus RANKL alone. (D) Mouse bone marrow macrophages were plated on sterile dentine slices and cultured in complete α-MEM containing RANKL(100 ng/mL) alone (R) or RANKL plus adenosine (R + A), azidothymidine (R + Z), and thymidine (R + T) (10 μM nucleosides) in the presence of M-CSF (10ng/mL) for 10 days. Fresh medium was changed in every 3 to 4 days. Dentine slices were examined by scanning electron microscopy. Representative pits caused by osteoclasts are marked with arrows. The data were quantified by measuring the percentage of the pit area in whole dentine slices.
Fig. 3
Fig. 3
Nucleosides accelerate osteolysis in mice immunized with collagen II in the presence and absence of CFA. (A) DBA1 mice were immunized with a single injection of collagen II alone (CII), CFA alone (CFA), and collagen II plus CFA (CII + CFA), as described previously. After 1 week of immunization, mice were injected intraperitoneally with PBS (top panel) or thymidine (T, middle panel), or azidothymidine (Z, bottle panel) (25 mg/kg/200 μL/mouse) daily 5 days per week. After euthanization, osteolysis was detected by μCT. Images are representative examples of the hind paw of mice from the different groups. Arrows indicate bone erosion. (B) The ratio of BV to TV (BV/TV) is calculated in each group of mice. The results are expressed as the mean ± SEM (n = 3/group). The p values for the relations are shown. (C) Semiquantification of histologic features was scored in each group of mice, as described previously. (D) Mouse bone marrow macrophages were isolated from mouse tibia of each group and plated on a 24-well plate at a concentration of 5 × 10⁴ cells. Cells were cultured in complete a-MEM containing RANKL and M-CSF for 4 more days. TRACP staining was performed, and TRACP+ osteoclasts with up to 3 nuclei were counted per well. The values are presented as the mean TRACP+ osteoclasts per well ± SEM.
Fig. 4
Fig. 4
Nucleosides activate the innate immune system by activating the TREM receptors. (A) Mouse RAW264.7 cells were treated without (C) or with RANKL(100 ng/mL) alone (R) or with RANKL plus nucleosides adenosine (R + A), thymidine (R + T), orazidothymidine (R + Z) (10μM) for 2 days. RT-PCR for Tracp, Trem2, and Gapdh genes was performed. (B) Mouse bone marrow macrophages were cultured with RANKL alone (100 ng/mL, R), RANKL plus 10 μM nucleosides adenosine (R + A), azidothymidine (R + Z), or thymidine (R + Z) in the presence of M-CSF (10ng/mL) for 24 hours. Cells were cultured with M-CSF alone as control (C). The expression levels of TRACP, TREM2, and actin were determined by Western blot in cell lysates. (C) Total RNA was prepared from spleens of nonimmunized control mice or collagen II–immunized mice with PBS or nucleosides (Tand Z). The levels of Tracp, trem1, Trem2, and Gapdh or 18S genes were analyzed by RT-PCR. (D) Mouse bone marrow cells were cultured without or with anti-TREM antibody (5 μg) in the absence or presence of RANKL (100 ng/mL) and/or nucleosides A, Z, and T (10 μM) for 4 days. TRACP staining was performed, and the number of TRACP+ multinuclear osteoclasts per well was measured. The values are presented as the mean ± SEM in three independent experiments. The p values are shown. (E) RAW264.7 cells were transfected with Trem2 siRNA and negative siRNA as a control per the manufacture's instructions (Santa Cruz Biotechnology). After 36 hours of transfection, cells were treated with or without nucleosides azidothymidine (Z) and thymidine (T) (10 μM) in the presence (R) or absence (C) of RANKL (100 ng/mL) for 4 days. The expression of Trem2 in transfected cells was determined by RT-PCR (upper gels). TRACP+ osteoclasts were counted. The results are expressed as the mean ± SEM of TRACP+ osteoclasts per well. (F) Mouse bone marrow macrophages were cultured with the nucleosides adenosine (A), thymidine (T), or azidothymidine (Z) for 8 hours in the presence of M-CSF and RANKL. Whole-cell lysates were subjected to Western blot analysis for phosphorylated PLCγ (p-PLCγ), total PLCγ, and NFATc-1 proteins. Actin is shown as loading control.
Fig. 5
Fig. 5
The role of the Nalp3 pathway in nucleoside-enhanced osteoclastogenesis. (A) Bone marrow cells from C57BL/6 mice (white columns) were plated and then cultured with ATP, nucleosides [adenosine (A), thymidine (T), and azidothymidine (Z)] for 24 hours in the absence or presence of caspase-1-specific inhibitor (zYVAD-fmk; black columns). Supernatants were harvested and assayed for mature IL-1β by ELISA. (B) Mouse bone marrow cells from C57BL/6 mice (white columns) and Nalp3−/− knockout mice (black columns) were treated with nucleosides for 24 hours. Supernatants were harvested and assayed for mature IL-1β by ELISA. (C) Bone marrow cells from C57BL/6 mice (white columns) and Nalp3−/− knockout mice (black columns) were cultured for 4 more days in the presence of M-CSF (10ng/mL) and RANKL (100 ng/mL). TRACP staining was performed, and TRACP+ osteoclasts with up to 3 nuclei were counted per well. The values are presented as the mean ± SEM. The p values are shown compared between macrophages from wild-type and knockout control mice in each indicated treatment. *p < .05 and **p < .01 indicate comparisons with non-nucleoside-treated macrophages from control wild-type and knockout mice.
Fig. 6
Fig. 6
The role of purinergic receptors in nucleoside-treated mouse bone marrow macrophages. (A) Mouse bone marrow macrophages were incubated for 4 days with PBS (C), azidothymidine (Z), adenosine (A), and thymidine (T) at 10μM in the absence or presence of RANKL (100 ng/mL, R) and purinergic receptor inhibitor (10 μM 8-PT, 50 μM DPCPX, or 10 μM ZM241385), as indicated. TRACP+ osteoclasts were counted. (B) RAW264.7 cells were transfected with A2bR siRNA and negative siRNA as control per the manufacture's instructions (Santa Cruz Biotechnology). Cells were treated with or without nucleosides in the presence or absence of RANKL at 36 hours after transfection. The level of A2bR was measured by RT-PCR (top panels). TRACP+ osteoclasts were counted. The results are expressed as the mean ± SEM of TRACP+ osteoclasts per well.
Fig. 7
Fig. 7
Analysis of cell populations that are involved in inflammation and bone destruction in peripheral blood cells derived from nucleosides-treated CIA mice. Heparinized blood was withdrawn (day 35) from nonimmunized control mice and CIA mice treated with nucleosides or PBS. Whole blood cells were stained with different fluorescence-conjugated antibodies specific for cell surface markers CD11b, CD4, CD8, and B220. Monocytes/macrophages and lymphocytes were discriminated based on their characteristic forward and side light-scatter profiles. Intracellular cytokines were analyzed by polychromic flow cytometry in peripheral blood samples from each group of mice. Following surface staining and lysis of red blood cells (BD Bioscience), cells were permeabilized and stained with fluorescence-conjugated antibodies to detect intracellular cytokines TNF-α, IFN-γ, IL4, and IL2. Analysis of flow cytometry data was performed using FlowJo software. The results are expressed as the mean ± SE, and the p values are shown compared with control. (A) The percentage of CD11b+ monocytes/macrophages within the pool of myeloids was determined for mice in different treatment groups. The p values are shown to compare with control mice. (B) Spleen-to-body-weight ratios in the different groups of mice were analyzed. The representative spleens from control and CIA + Z groups are shown. (C) The percentage of peripheral blood CD11b+ monocytes/macrophages expressing TNF-α, IL-4, IFN-γ, or IL-2 was determined for individual mice in different treatment groups. The results are expressed as the mean ± SEM. The standard Student's t test shows the statistical significance of cytokine-producing monocytes/macrophages in the nucleoside-treated CIA mice. (D) The concentrations of TNF-α in mouse serum from each group of mice were measured by sandwich ELISA according to the manufacturer's protocol (R&D Systems). Both intra- and interassays coefficients of variation were less than 8% for all assays. The results are expressed as the mean ±SEM. (E) The percentages of CD4 and CD8T-lymphocytes in the total blood cells were determined in the different groups of mice. The results are expressed as the mean ± SEM. (F) Schematic illustration of the mechanisms of nucleoside-accelerated osteolysis.

Similar articles

Cited by

References

    1. McInnes IB, Schett G. Cytokines in the pathogenesis of rheumatoid arthritis. Nat Rev Immunol. 2007;7:429–442. - PubMed
    1. Zink A, Listing J, Kary S, et al. Treatment continuation in patients receiving biological agents or conventional DMARD therapy. Ann Rheum Dis. 2005;64:1274–1279. - PMC - PubMed
    1. Cella M, Buonsanti C, Strader C, Kondo T, Salmaggi A, Colonna M. Impaired differentiation of osteoclasts in TREM-2-deficient individuals. J Exp Med. 2003;198:645–651. - PMC - PubMed
    1. Martinon F, Burns K, Tschopp J. The inflammasome: a molecular platform triggering activation of inflammatory caspases and processing of proIL-β. Mol Cell. 2002;10:417–426. - PubMed
    1. Deane JA, Bolland S. Nucleic acid-sensing TLRs as modifiers of autoimmunity. J Immunol. 2006;177:6573–6578. - PubMed

Publication types

MeSH terms