. 2011 Aug;26(8):1883-90.
doi: 10.1002/jbmr.401.

Fibroblast growth factor 23 regulates renal 1,25-dihydroxyvitamin D and phosphate metabolism via the MAP kinase signaling pathway in Hyp mice

Affiliations

Fibroblast growth factor 23 regulates renal 1,25-dihydroxyvitamin D and phosphate metabolism via the MAP kinase signaling pathway in Hyp mice

Daniel Ranch et al. J Bone Miner Res. 2011 Aug.

Abstract

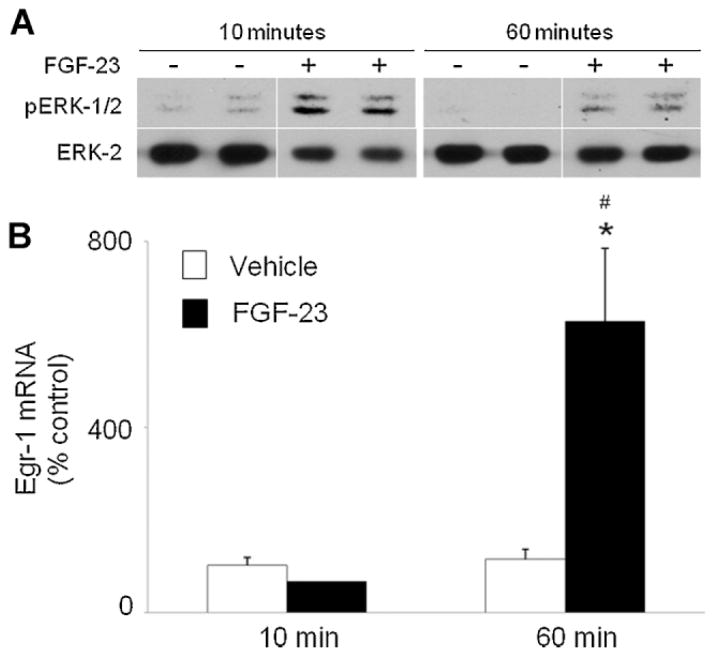
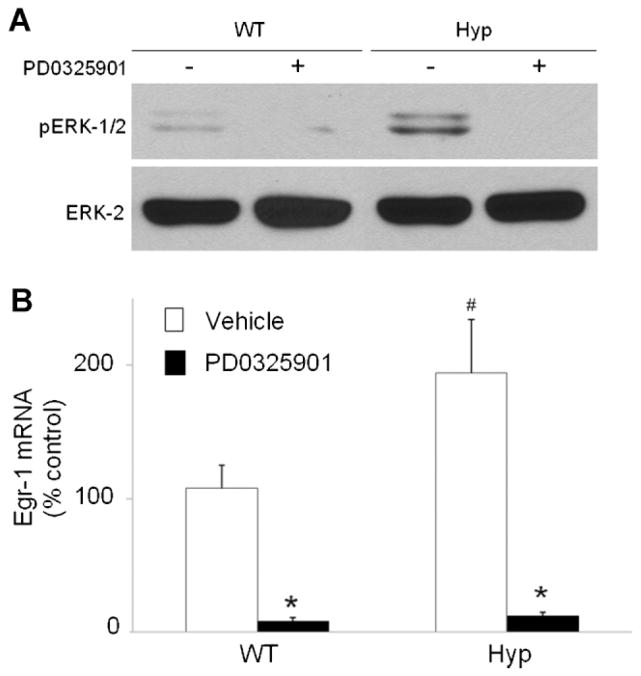
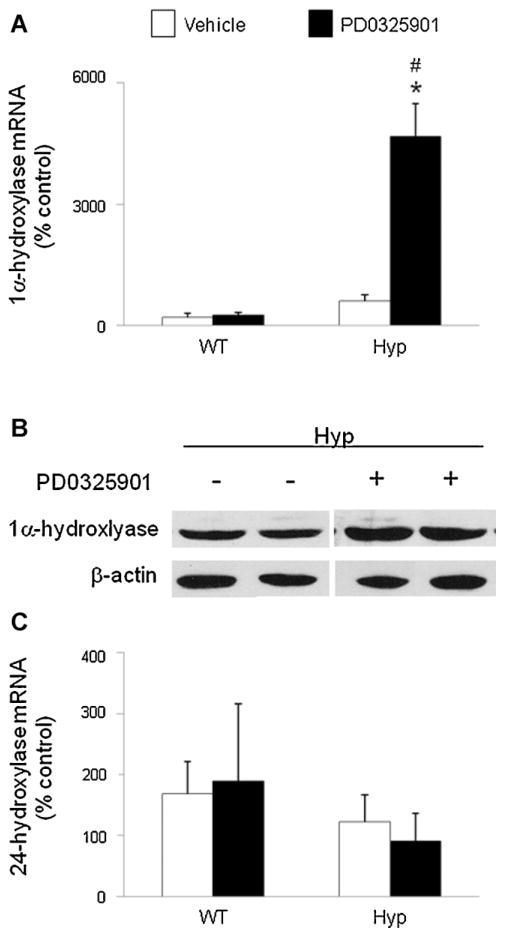
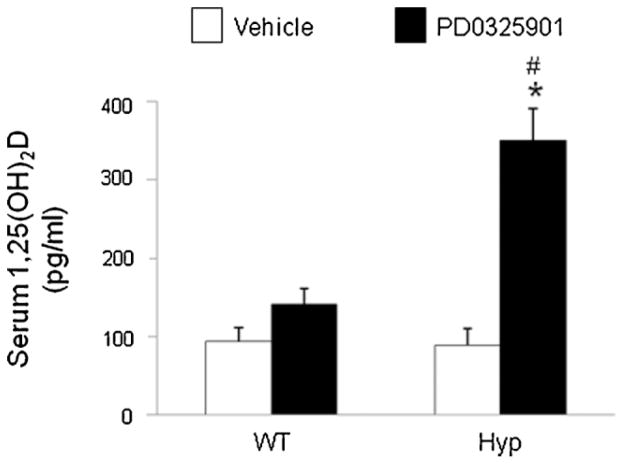
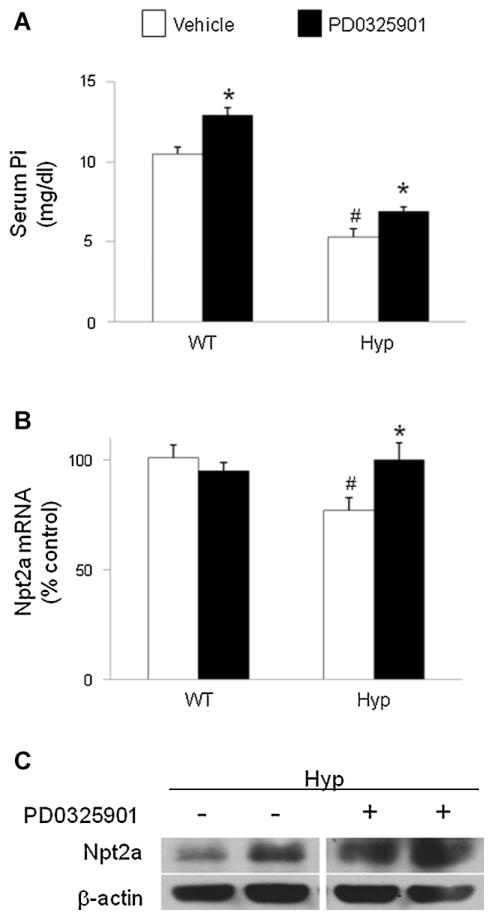
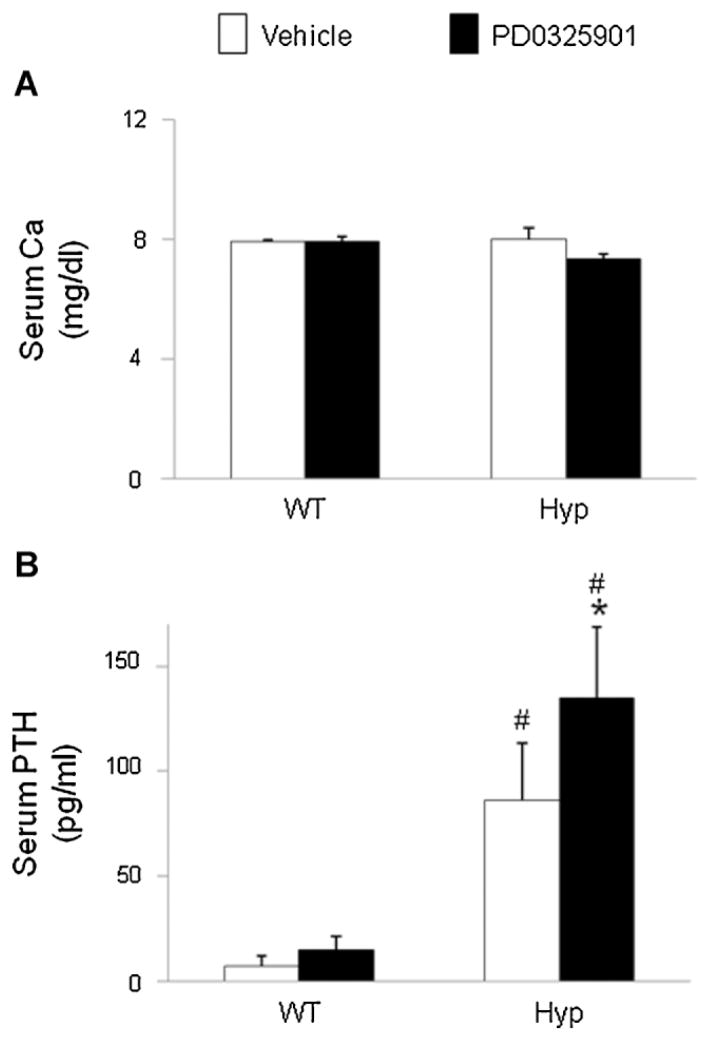
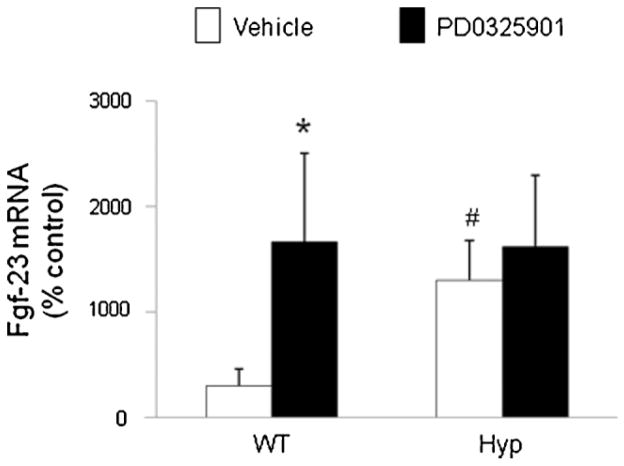
In X-linked hypophosphatemia (XLH) and in its murine homologue, the Hyp mouse, increased circulating concentrations of fibroblast growth factor 23 (FGF-23) are critical to the pathogenesis of disordered metabolism of phosphate (P(i)) and 1,25-dihydroxyvitamin D [1,25(OH)(2)D]. In this study, we hypothesized that in Hyp mice, FGF-23-mediated suppression of renal 1,25(OH)(2)D production and P(i) reabsorption depends on activation of mitogen-activated protein kinase (MAPK) signaling. Wild-type and Hyp mice were administered either vehicle or the MEK inhibitor PD0325901 (12.5 mg/kg) orally daily for 4 days. At baseline, the renal abundance of early growth response 1 (egr1) mRNA was approximately 2-fold greater in Hyp mice than in wild-type mice. Treatment with PD0325901 greatly suppressed egr1 mRNA abundance in both wild-type and Hyp mice. In Hyp mice, PD0325901 induced an 8-fold increase in renal 1α-hydroxylase mRNA expression and a 4-fold increase in serum 1,25(OH)(2)D concentrations compared with vehicle-treated Hyp mice. Serum P(i) levels in Hyp mice increased significantly after treatment with PD0325901, and the increase was associated with increased renal Npt2a mRNA abundance and brush-border membrane Npt2a protein expression. These findings provide evidence that in Hyp mice, MAPK signaling is constitutively activated in the kidney and support the hypothesis that the FGF-23-mediated suppression of renal 1,25(OH)(2)D production and P(i) reabsorption depends on activation of MAPK signaling via MEK/ERK1/2. These findings demonstrate the physiologic importance of MAPK signaling in the actions of FGF-23 in regulating renal 1,25(OH)(2)D and P(i) metabolism.


Conflict of interest statement

Disclosures

All the authors state that they have no conflicts of interest.

Figures

Fig. 1
Fig. 1
Effect of FGF-23 on renal MEK/ERK1/2 signaling in wild-type mice. Mice were injected with FGF-23 or vehicle and euthanized 10 and 60 minutes later. (A) Whole-kidney tissue protein extracts were probed with rabbit anti-phospho-ERK1/2 antibodies (top panel). Protein loading was determined using total ERK2 protein (bottom panel). (B). Egr1 mRNA abundance was quantitated by real-time PCR, normalized to that of Gus mRNA, and expressed as a percent relative to vehicle. Bars depict mean ± SEM (n = 4 to 6 mice/group). *p <.05 compared with the vehicle group.
Fig. 2
Fig. 2
Effect of PD0325901 on renal MEK/ERK1/2 signaling in wild-type and Hyp mice. Mice were administered PD0325901 or vehicle for 4 days. (A) Whole-kidney tissue protein extracts were probed with rabbit anti-phospho-ERK1/2 antibodies. (B) Egr1 mRNA abundance, normalized to that of Gus mRNA, is expressed as a percent relative to vehicle-treated wild-type mice. Bars depict mean ± SEM (n =7 to 8 mice/group). #p <.05 compared with wild-type mice treated with vehicle. *p <.05 compared with vehicle-treated mice within each mouse strain.
Fig. 3
Fig. 3
Effects of MEK inhibition by PD0325901 on 1,25(OH)2D metabolism in wild-type and Hyp mice. Mice were administered PD0325901 or vehicle for 4 days. (A) Renal 1α-hydroxylase mRNA abundance was quantitated by real-time PCR, normalized to that of Gus mRNA, and expressed as a percent relative to vehicle-treated wild-type mice. (B) Renal mitochondrial 1α-hydroxylase protein abundance in Hyp mice determined by a Western blot analysis. Protein loading was determined using β-actin. The immunoblot represents data from 2 mice/group. (C) Renal 24-hydroxylase mRNA abundance was quantitated as above. Bars depict mean ± SEM (n =7 to 12 mice/group). #p <.05 compared with wild-type mice within each treatment group. *p <.05 compared with vehicle-treated mice within each mouse strain.
Fig. 4
Fig. 4
Effects of MEK inhibition by PD0325901 on serum 1,25(OH)2D concentrations in wild-type and Hyp mice. Mice were administered PD0325901 or vehicle for 4 days. #p <.05 compared with wild-type mice within each treatment group. *p <.05 compared with vehicle-treated mice within each mouse strain.
Fig. 5
Fig. 5
Effects of MEK inhibition by PD0325901 on phosphate metabolism in wild-type and Hyp mice. Mice were administered PD0325901 or vehicle for 4 days. (A) Serum Pi concentrations. (B) Renal Npt2a mRNA abundance was quantitated by real-time PCR, normalized to that of Gus mRNA, and expressed as a percent relative to vehicle-treated wild-type mice. (C) Renal brush-border Npt2a protein abundance. Protein loading was determined using β-actin. Bars depict mean ± SEM (n =7 to 12 mice/group) #p <.05 compared with wild-type mice within each treatment group. *p <.05 compared with vehicle-treated mice within each mouse strain.
Fig. 6
Fig. 6
Effects of MEK inhibition by PD0325901 on serum calcium and iPTH concentrations in wild-type and Hyp mice. Mice were administered PD0325901 or vehicle for 4 days. (A) Serum calcium concentrations. (B) Serum iPTH concentrations. Bars depict mean ± SEM (n =7 to 12 mice/ group) #p <.05 compared with wild-type mice within each treatment group. *p <.05 compared with vehicle-treated mice within each mouse strain.
Fig. 7
Fig. 7
Effects of MEK inhibition by PD0325901 on fgf23 mRNA in bone in wild-type and Hyp mice. Mice were administered PD0325901 or vehicle for 4 days. Femoral bone fgf23 mRNA abundance was quantitated by real-time PCR, normalized to that of Gapdh mRNA, and expressed as a percent relative to vehicle-treated mice. Bars depict mean ± SEM (n =7 to 12 mice/group) #p <.05 compared with wild-type mice within each treatment group. *p <.05 compared with vehicle-treated mice within each mouse strain.

References

    1. Yamazaki Y, Okazaki R, Shibata M, et al. Increased circulatory level of biologically active full-length FGF-23 in patients with hypophosphatemic rickets/osteomalacia. J Clin Endocrinol Metab. 2002;87:4957–4960. - PubMed
    1. Jonsson KB, Zahradnik R, Larsson T, et al. Fibroblast growth factor 23 in oncogenic osteomalacia and X-linked hypophosphatemia. N Engl J Med. 2003;348:1656–1663. - PubMed
    1. Imel EA, Hui SL, Econs MJ. FGF-23 concentrations vary with disease status in autosomal dominant hypophosphatemic rickets. J Bone Miner Res. 2007;22:520–526. - PubMed
    1. Feng JQ, Ward LM, Liu S, et al. Loss of DMP1 causes rickets and osteomalacia and identifies a role for osteocytes in mineral metabolism. Nat Genet. 2006;38:1310–1315. - PMC - PubMed
    1. . A gene (PEX) with homologies with endopeptidases is mutated in patients with X-linked hypophosphatemic rickets. The HYP Consortium. Nat Genet. 1995;11:130–136. - PubMed

Publication types

MeSH terms