. 2011 May 1;83(9):3563-71.
doi: 10.1021/ac200143v. Epub 2011 Apr 7.

Higher sensitivity dopamine measurements with faster-scan cyclic voltammetry

Affiliations

Higher sensitivity dopamine measurements with faster-scan cyclic voltammetry

Richard B Keithley et al. Anal Chem. .

Abstract

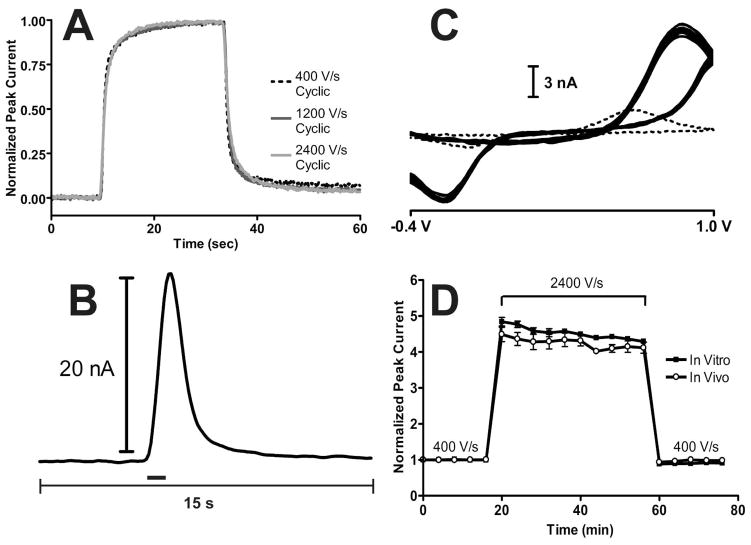
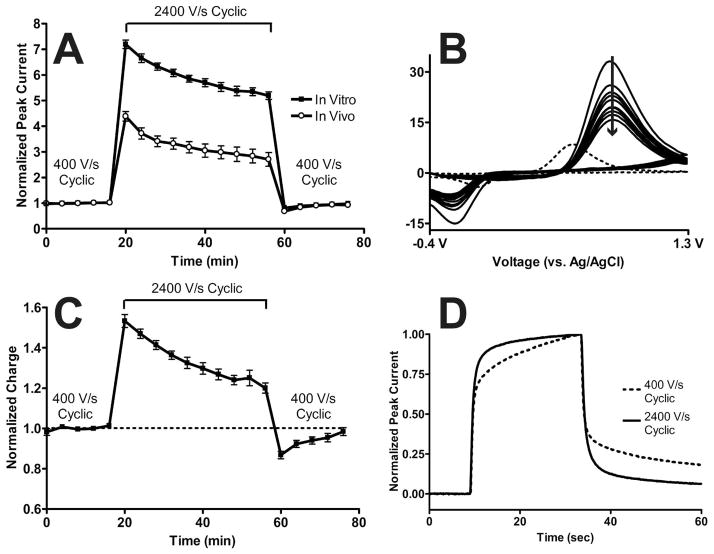
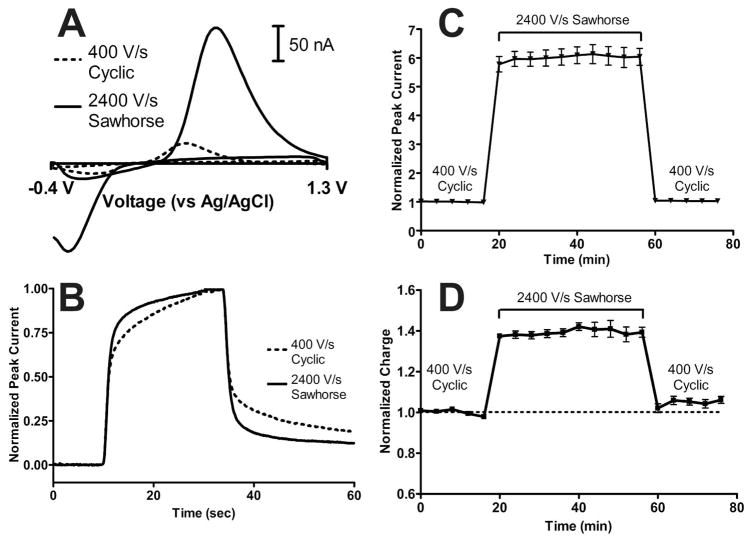
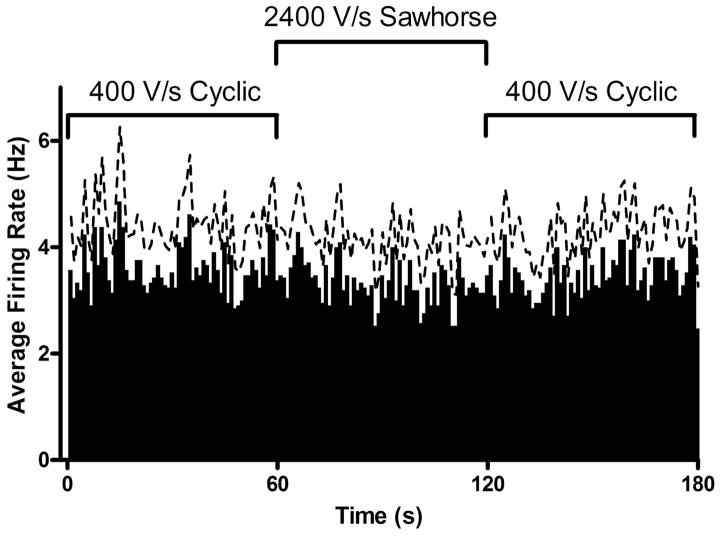
Fast-scan cyclic voltammetry (FSCV) with carbon-fiber microelectrodes has been successfully used to detect catecholamine release in vivo. Generally, waveforms with anodic voltage limits of 1.0 or 1.3 V (vs Ag/AgCl) are used for detection. The 1.0 V excursion provides good temporal resolution but suffers from a lack of sensitivity. The 1.3 V excursion increases sensitivity but also increases response time, which can blur the detection of neurochemical events. Here, the scan rate was increased to improve the sensitivity of the 1.0 V excursion while maintaining the rapid temporal response. However, increasing scan rate increases both the desired faradaic current response and the already large charging current associated with the voltage sweep. Analog background subtraction was used to prevent the analog-to-digital converter from saturating from the high currents generated with increasing scan rate by neutralizing some of the charging current. In vitro results with the 1.0 V waveform showed approximately a 4-fold increase in signal-to-noise ratio with maintenance of the desired faster response time by increasing scan rate up to 2400 V/s. In vivo, stable stimulated release was detected with an approximate 4-fold increase in peak current. The scan rate of the 1.3 V waveform was also increased, but the signal was unstable with time in vitro and in vivo. Adapting the 1.3 V triangular wave into a sawhorse design prevented signal decay and increased the faradaic response. The use of the 1.3 V sawhorse waveform decreased the detection limit of dopamine with FSCV to 0.96 ± 0.08 nM in vitro and showed improved performance in vivo without affecting the neuronal environment. Electron microscopy showed dopamine sensitivity is in a quasi-steady state with carbon-fiber microelectrodes scanned to potentials above 1.0 V.


Figures

Figure 1
Figure 1
Performance characteristics of the 1.0 V waveform upon increasing scan rate. A) Temporal response for in vitro injections of 1 μM dopamine at 400 V/s (black dashed line), 1200 V/s (dark grey solid line), and 2400 V/s (light grey solid line) for a representative electrode. B) Current versus time trace at the oxidation potential of dopamine for a representative stimulation in an anesthetized rat. The black bar indicates the duration of the stimulus. C) Cyclic voltammograms from ten consecutive stimulated dopamine release events measured in vivo at 2400 V/s (solid lines) from a representative animal. The dotted line represents the cyclic voltammogram of dopamine at 400 V/s for comparison. D) Baseline normalized dopamine peak current as a function of time for the 1.0 V waveform at 400 V/s, 2400 V/s, and back to 400 V/s in vitro (filled squares) and in vivo (open circles). In vitro peak currents were measured from 1 μM dopamine injections (N = 5 electrodes) and in vivo responses were measured from stimulated dopamine release in anesthetized rats (N = 5 rats). Both responses were measured every four minutes.
Figure 2
Figure 2
Performance characteristics of the 1.3 V cyclic waveform upon increasing scan rate. A) Baseline normalized dopamine peak current as a function of time for the 1.3 V cyclic waveform at 400 V/s, 2400 V/s, and back to 400 V/s in vitro (filled squares) and in vivo (open circles). In vitro peak currents were measured from 1 μM dopamine injections (N = 5 electrodes) and in vivo responses were measured from stimulated dopamine release in anesthetized rats (N = 5 rats). Both responses were measured every four minutes. B) Cyclic voltammograms from ten consecutive stimulated dopamine release events measured in vivo at 2400 V/s (solid lines) from a representative animal. The arrow indicates time progression. The dotted line represents the cyclic voltammogram of dopamine at 400 V/s for comparison. C) Baseline normalized charge for the in vitro data shown in A). D) Temporal response for in vitro injections of 1 μM dopamine at 400 V/s (black dashed line) and 2400 V/s (black solid line).
Figure 3
Figure 3
In vitro performance of the 1.3 V sawhorse waveform. A) Representative cyclic voltammograms for the 1.3 V cyclic waveform at 400 V/s (dashed trace) and the 1.3 V sawhorse waveform at 2400 V/s (solid trace). B) Temporal response for in vitro injections of 1 μM dopamine at 400 V/s with the 1.3 V cyclic waveform (black dashed line) and at 2400 V/s with the 1.3 V sawhorse waveform (black solid line). C) Baseline normalized dopamine peak current as a function of time for the 1.3 V cyclic waveform at 400 V/s, the 1.3 V sawhorse waveform at 2400 V/s, and back to the 1.3 V cyclic waveform at 400 V/s in vitro. In vitro peak currents were measured from 1 μM dopamine injections measured every four minutes (N = 5 electrodes). D) Baseline normalized charge for the in vitro data shown in C).
Figure 4
Figure 4
In vivo performance of the 1.3 V sawhorse waveform in vivo in anesthetized rats. A) Color plot representation of stimulated dopamine release with the 1.3 V cyclic waveform at 400 V/s. B) Color plot representation of stimulated dopamine release with the 1.3 V sawhorse waveform at 2400 V/s. Both A) and B) have the voltammetric sweep plotted to the left of the color plot and the time axis plotted below B). The black bar indicates the duration of the stimulus. C) Baseline normalized dopamine peak current as a function of time for the 1.3 V cyclic waveform at 400 V/s, the 1.3 V sawhorse waveform at 2400 V/s, and back to the 1.3 V cyclic waveform at 400 V/s in vivo (N = 8 locations in seven rats). D) Baseline normalized charge for the in vivo data shown in C).
Figure 5
Figure 5
Average glutamate-evoked firing rate of striatal neurons as a function of time for the 1.3 V cyclic waveform at 400 V/s, the 1.3 V sawhorse waveform at 2400 V/s, and back to the 1.3 V cyclic waveform at 400 V/s (N = 21 cells in 4 rats). The dashed line represents standard error of the mean.
Figure 6
Figure 6
Carbon-fiber microelectrode etching as a function of the applied waveform. Etch rates for (I) the 1.0 V waveform at 400 V/s, (II) the 1.0 V waveform at 2400 V/s, (III) the 1.3 V cyclic waveform at 400 V/s, (IV) the 1.3 V cyclic waveform at 2400 V/s, and (V) the 1.3 V sawhorse waveform at 2400 V/s. Etch rates are quantified as Angstroms per one thousand waveform applications. N = 5 electrodes for each condition. Only selected comparisons are shown for clarity (n.s. – no significant difference, ** - P < 0.01, *** - P < 0.001).

References

    1. Robinson DL, Wightman RM. In: Electrochemical Methods for Neuroscience. Michael AC, Borland LM, editors. CRC Press; Boca Raton, FL: 2007. pp. 17–36.
    1. Ge S, Koseoglu S, Haynes C. Anal Bioanal Chem. 2010;397:3281–3304. - PubMed
    1. Petrovic J, Walsh PL, Thornley KT, Miller CE, Wightman RM. Endocrinology. 2010;151:1773–1783. - PMC - PubMed
    1. Rice ME, Nicholson C. Anal Chem. 1989;61:1805–1810. - PubMed
    1. Strand AM, Venton BJ. Anal Chem. 2008;80:3708–3715. - PubMed

Publication types