

Quantifying, displaying and accounting for heterogeneity in the meta-analysis of RCTs using standard and generalised Q statistics
- PMID: 21473747
- PMCID: PMC3102034
- DOI: 10.1186/1471-2288-11-41
Quantifying, displaying and accounting for heterogeneity in the meta-analysis of RCTs using standard and generalised Q statistics
Abstract
Background: Clinical researchers have often preferred to use a fixed effects model for the primary interpretation of a meta-analysis. Heterogeneity is usually assessed via the well known Q and I2 statistics, along with the random effects estimate they imply. In recent years, alternative methods for quantifying heterogeneity have been proposed, that are based on a 'generalised' Q statistic.
Methods: We review 18 IPD meta-analyses of RCTs into treatments for cancer, in order to quantify the amount of heterogeneity present and also to discuss practical methods for explaining heterogeneity.
Results: Differing results were obtained when the standard Q and I2 statistics were used to test for the presence of heterogeneity. The two meta-analyses with the largest amount of heterogeneity were investigated further, and on inspection the straightforward application of a random effects model was not deemed appropriate. Compared to the standard Q statistic, the generalised Q statistic provided a more accurate platform for estimating the amount of heterogeneity in the 18 meta-analyses.
Conclusions: Explaining heterogeneity via the pre-specification of trial subgroups, graphical diagnostic tools and sensitivity analyses produced a more desirable outcome than an automatic application of the random effects model. Generalised Q statistic methods for quantifying and adjusting for heterogeneity should be incorporated as standard into statistical software. Software is provided to help achieve this aim.
Figures
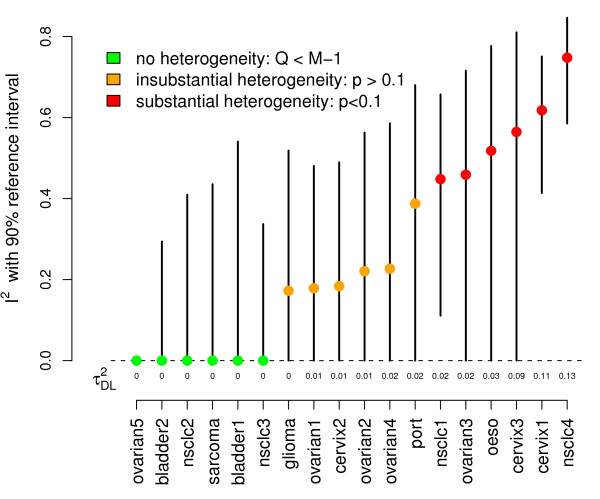
 statistic (with 90% reference intervals) from each study;
  also shown.
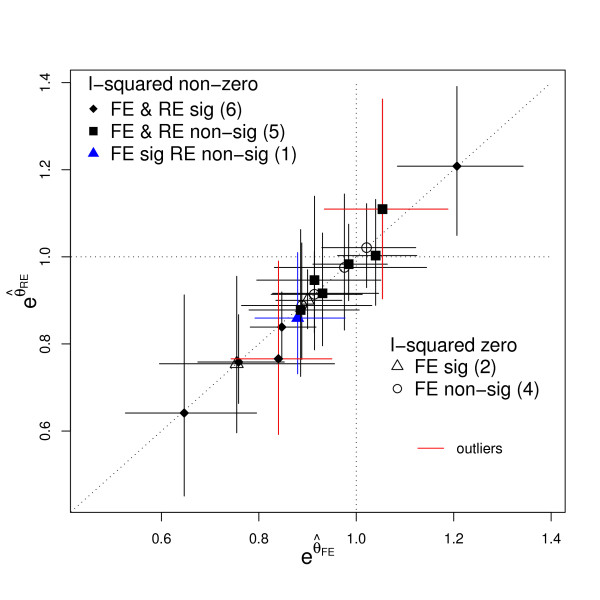
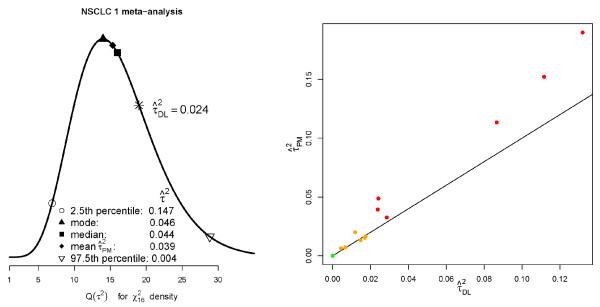
 versus for all 18 meta-analyses.
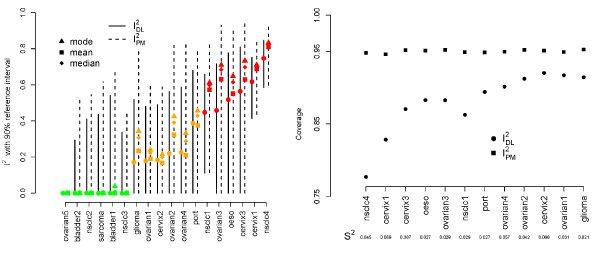 and
and  estimates; Right: Coverage of 95% reference intervals for the and estimates.
References
MeSH terms
LinkOut - more resources
Full Text Sources
