. 2011 Apr 8;42(1):36-49.
doi: 10.1016/j.molcel.2011.02.020.

Activation of the PIK3CA/AKT pathway suppresses senescence induced by an activated RAS oncogene to promote tumorigenesis

Affiliations

Activation of the PIK3CA/AKT pathway suppresses senescence induced by an activated RAS oncogene to promote tumorigenesis

Alyssa L Kennedy et al. Mol Cell. .

Abstract

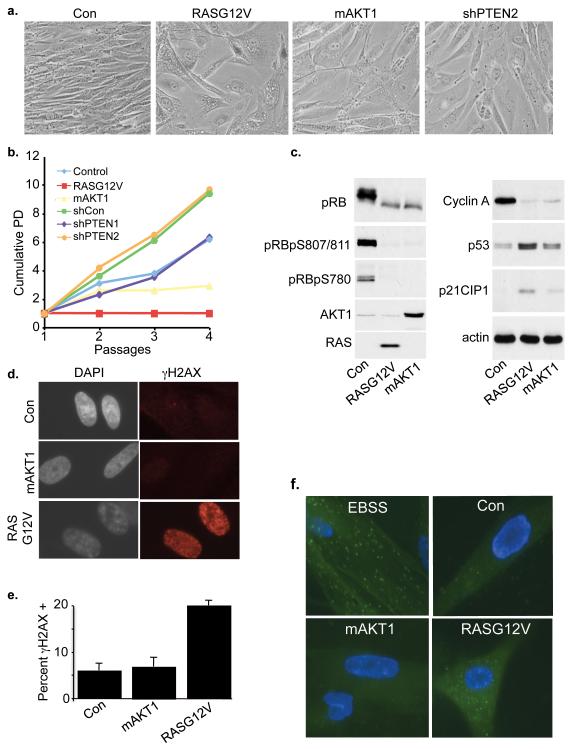
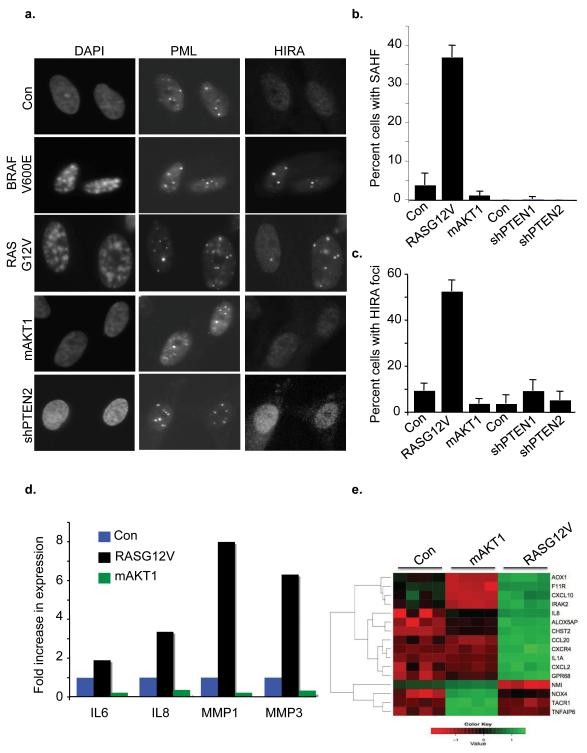
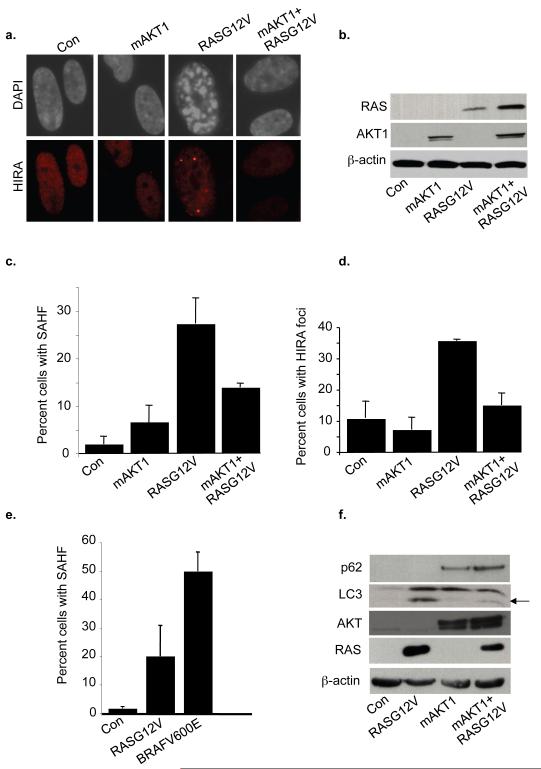
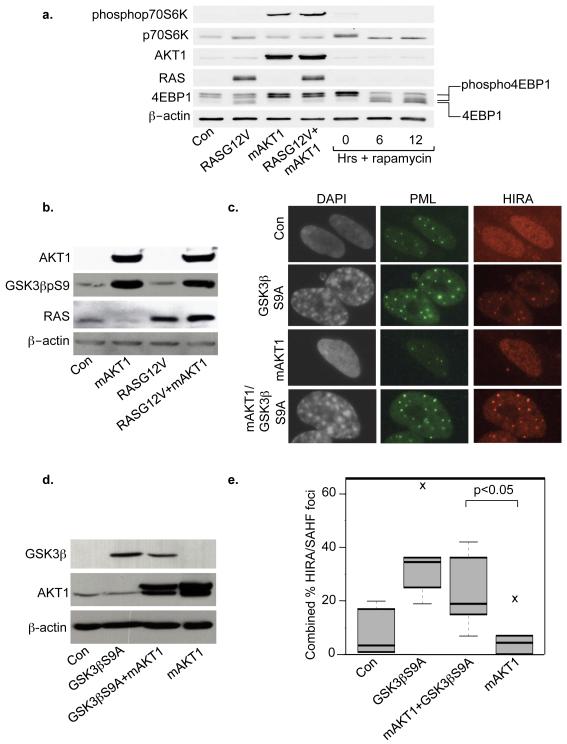
Mutations in both RAS and the PTEN/PIK3CA/AKT signaling module are found in the same human tumors. PIK3CA and AKT are downstream effectors of RAS, and the selective advantage conferred by mutation of two genes in the same pathway is unclear. Based on a comparative molecular analysis, we show that activated PIK3CA/AKT is a weaker inducer of senescence than is activated RAS. Moreover, concurrent activation of RAS and PIK3CA/AKT impairs RAS-induced senescence. In vivo, bypass of RAS-induced senescence by activated PIK3CA/AKT correlates with accelerated tumorigenesis. Thus, not all oncogenes are equally potent inducers of senescence, and, paradoxically, a weak inducer of senescence (PIK3CA/AKT) can be dominant over a strong inducer of senescence (RAS). For tumor growth, one selective advantage of concurrent mutation of RAS and PTEN/PIK3CA/AKT is suppression of RAS-induced senescence. Evidence is presented that this new understanding can be exploited in rational development and targeted application of prosenescence cancer therapies.


Figures

Figure 1
Figure 1. Inactivation of PTEN and activation of AKT1 fails to induce robust growth arrest
(a) BJ-hTERT fibroblasts were transduced with either control, mAKT1, RasG12V retroviruses or a lentivirus encoding a short hairpin to PTEN. Cells were drug selected and bright field images taken 7 days later. (b) Growth curves of cells from (a). (c) IMR90 fibroblasts were transduced with control, mAKT1 or RASG12V. Cells were drug selected for 7 days, lysates prepared and western blotted. (d) Cells from (c) were fixed and stained for γH2AX. (e) Percent cells from (d) containing at least 20 foci of γH2AX. Mean of 3 experiments with standard deviation. (f) IMR90 cells were co-transduced with EGFP-LC3 and control, RASG12V or mAKT1. As a positive control for autophagosome formation, EGFP-LC3 expressing cells were treated with Earle’s Balanced Salt Solution (EBSS) for 1 hour.
Figure 2
Figure 2. AKT activation fails to induce SAHF or the senescence-secretome
(a) IMR90 fibroblasts were transduced with BRAFV600E, RASG12V, mAKT1 or a short hairpin that targets PTEN. Cells were drug selected, fixed and stained for SAHF, PML or HIRA foci. (b) and (c) One hundred cells from (a) were scored for HIRA foci or SAHF. Mean of 3 experiments with standard deviation. (d) RNA was harvested from mAKT1, RASG12V or control cells and assayed for expression of IL-6, IL-8, MMP-1 and MMP-3 by quantitative RT-PCR. (e) Expression profiling was performed on control, RASG12V or mAKT1 transduced IMR90. Heatmap of significantly upregulated (green) and downregulated (red) genes with GO classification “Inflammation” is shown.
Figure 3
Figure 3. Activation of AKT antagonizes RASG12V-induced SAHF formation and Autophagy
IMR90 fibroblasts were transduced with either control, mAKT1, RASG12V or both mAKT1 and RASG12V and double drug selected for 7 days. Cells were then fixed and stained for HIRA foci and SAHF. (b) Expression of transduced proteins and phosphorylation of AKT (AKTpS473) was assayed by western blotting. (c) and (d) One hundred cells from (a) were scored for HIRA foci or SAHF. Mean of 3 experiments with standard deviation. (e) IMR90 cells were transduced with RASG12V or BRAFV600E and scored for SAHF formation at 5 days post drug selection. Mean of 3 experiments with standard deviation. (f) Western blotting of cell lysates from (a) with indicated antibodies. The arrow marks the cleaved lipidated form of LC3, LC3-II.
Figure 4
Figure 4. mAKT1 counters effects of RASG12V on mTOR and GSK3β
(a) IMR90 cells were transduced with control, RASG12V, mAKT1 or both RASG12V and mAKT1. Cells were double drug selected, lysates prepared and western blotted. Uninfected cells were treated with 1nM rapamycin to define unphospho and phospho-4EBP1. (b) Western blotting of cells from (a). (c) IMR90 cells were transduced with control, GSK3βS9A, mAKT1 or both GSK3βS9A and mAKT. Cells were fixed and stained for PML, HIRA foci or SAHF. (d) Expression of proteins in (c) was verified by western blotting. (e) One hundred cells from (c) were scored for both HIRA foci and SAHF and a combined score plotted. The horizontal line inside the box is the median (50th percentile); the box itself encompasses the 25th and 75th percentiles (Inter Quartile Range (IQR)); the whiskers are the most extreme data points within 1.5×IQR; crosses outside the whiskers are outliers.
Figure 5
Figure 5. GSK3βps9, AKTpS473 and mTORpS2448 phosphorylation correlates with poor overall survival in human pancreatic cancer
(a) Representative ‘high’(left panel) and ‘low’(right panel) scoring images of GSK3βps9 immunohistochemical staining from a human pancreatic adenocarcinoma tissue microarray. (b) Kaplan Meier curve representing patient survival per unit time. Survival is shown for patients with tumors with GSK3βps9 >100 (High) and <100 (Low). (c) Kaplan Meier curve for patients with low AKT1pS473/low mTORpS2448 and high AKT1pS473/high mTORpS2448. (d) Mean survival of indicated groups of patients. For each phospho-epitope in (b)-(d), the high staining group comprised 24 patients and the low staining group comprised 18 patients.
Figure 6
Figure 6. Inactivation of PTEN abrogates a senescence-like state in a mouse model of pancreatic cancer
(a) Immunohistochemical staining of PanIN from pancreata of mice of indicated genotype. Markers of senescence include SA β-gal and p21; markers of proliferation include Ki67 and MCM2. (b) Quantitation of p53, p21 and BrdU from (a). Box plots as Figure 4e. (c) and (d) Kaplan Meier curve showing percentage of animals of indicated genotype surviving per unit time.
Figure 7
Figure 7. Rapamycin reactivates senescence in PDAC harboring activated PIK3CA/AKT
(a) Immunohistochemical staining of AKT pathway activation in pancreata of RASG12D/PTENfl/fl mice or RASG12D mice. (b) RASG12D/PTENfl/+ mice were treated with rapamycin for 7 days and then pancreata harvested and stained for p53, p21 and BrdU. Box plots as Figure 4e.

Comment in

  • Senescence: Double or quit?
    Burgess DJ. Burgess DJ. Nat Rev Cancer. 2011 Jun;11(6):389. doi: 10.1038/nrc3070. Epub 2011 May 12. Nat Rev Cancer. 2011. PMID: 21562582 No abstract available.

References

    1. Acosta JC, O’Loghlen A, Banito A, Guijarro MV, Augert A, Raguz S, Fumagalli M, Da Costa M, Brown C, Popov N, et al. Chemokine signaling via the CXCR2 receptor reinforces senescence. Cell. 2008;133:1006–1018. - PubMed
    1. Adams PD. Healing and hurting: molecular mechanisms, functions, and pathologies of cellular senescence. Mol Cell. 2009;36:2–14. - PubMed
    1. Alimonti A, Nardella C, Chen Z, Clohessy JG, Carracedo A, Trotman LC, Cheng K, Varmeh S, Kozma SC, Thomas G, et al. A novel type of cellular senescence that can be enhanced in mouse models and human tumor xenografts to suppress prostate tumorigenesis. J Clin Invest. 2010;120:681–693. - PMC - PubMed
    1. Altomare DA, Tanno S, De Rienzo A, Klein-Szanto AJ, Skele KL, Hoffman JP, Testa JR. Frequent activation of AKT2 kinase in human pancreatic carcinomas. J Cell Biochem. 2002;87:470–476. - PubMed
    1. Asano T, Yao Y, Zhu J, Li D, Abbruzzese JL, Reddy SA. The PI 3-kinase/Akt signaling pathway is activated due to aberrant Pten expression and targets transcription factors NF-kappaB and c-Myc in pancreatic cancer cells. Oncogene. 2004;23:8571–8580. - PubMed

Publication types

MeSH terms

Substances