. 2011 Apr 8;8(4):399-411.
doi: 10.1016/j.stem.2011.02.006.

Targeting HIF1α eliminates cancer stem cells in hematological malignancies

Affiliations

Targeting HIF1α eliminates cancer stem cells in hematological malignancies

Yin Wang et al. Cell Stem Cell. .

Abstract

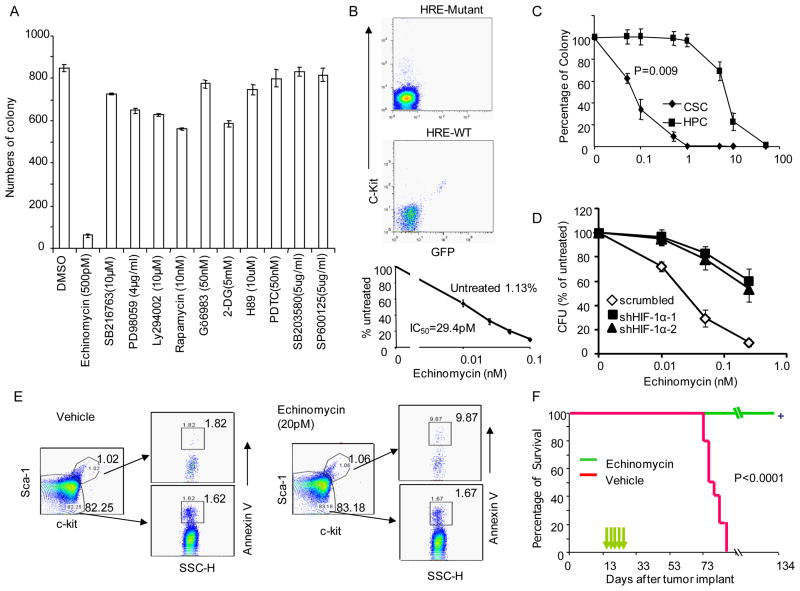
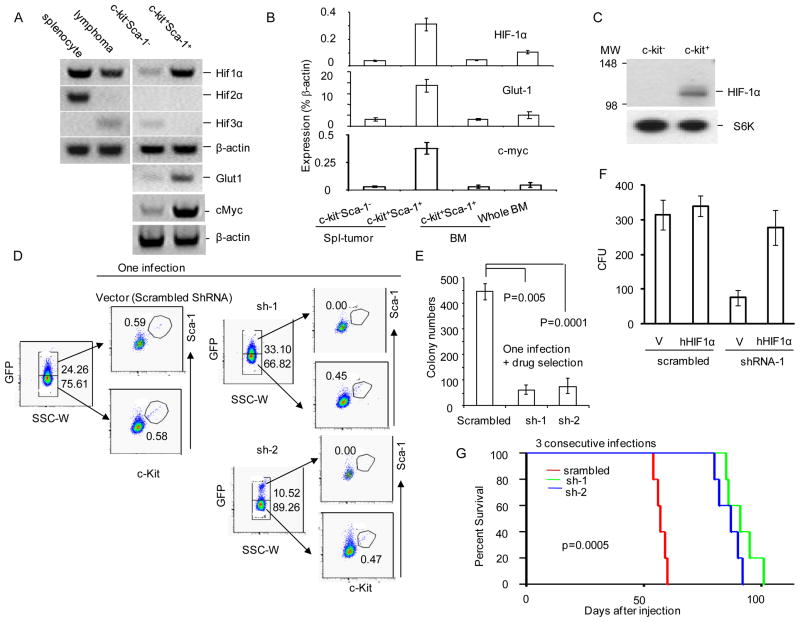
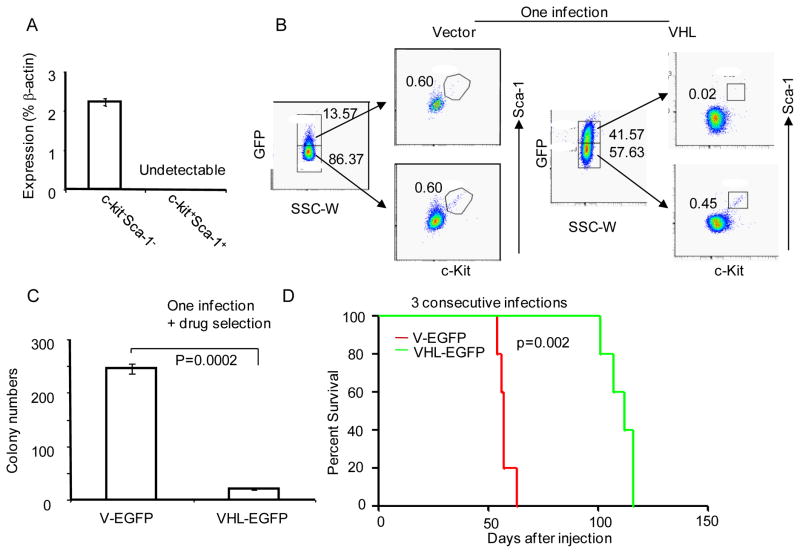
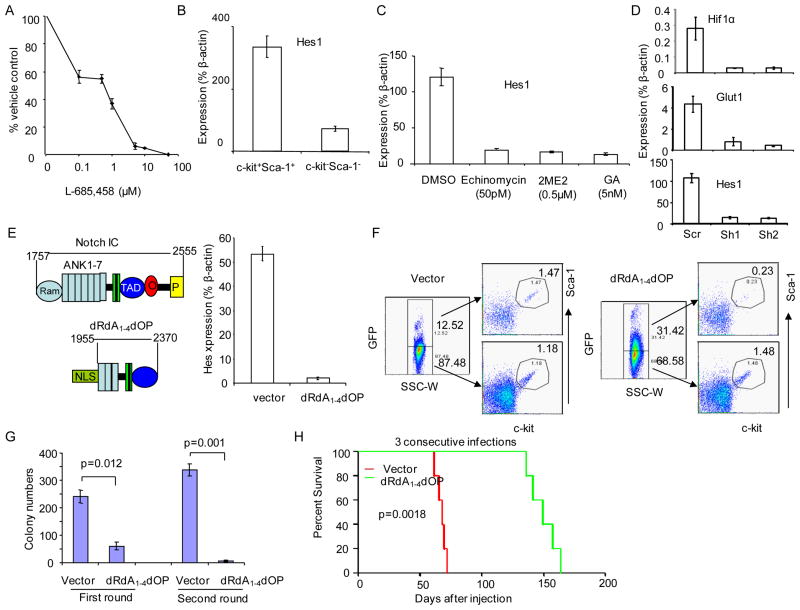
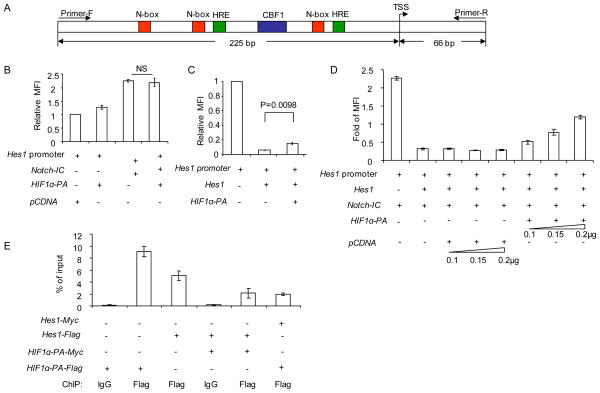
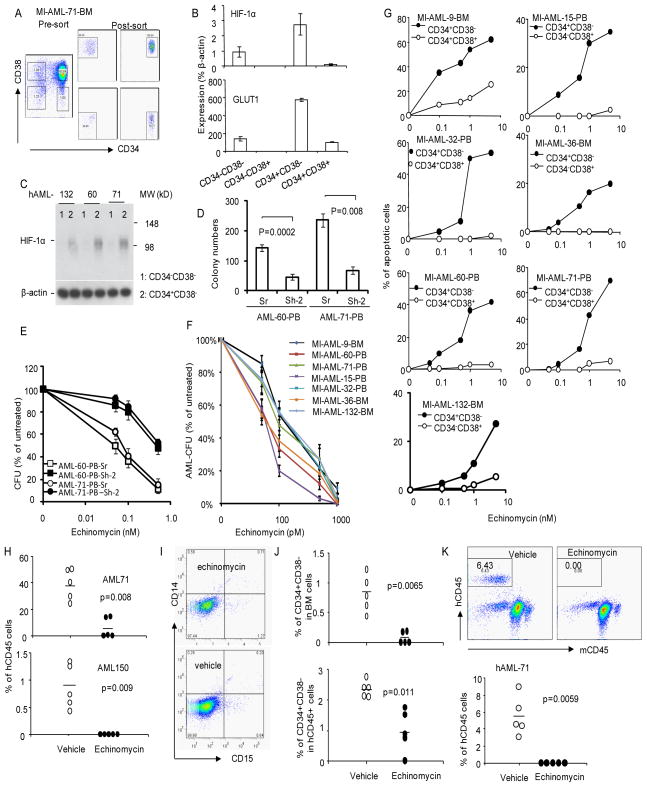
Molecular targeting of cancer stem cells (CSCs) has therapeutic potential for efficient treatment of cancer, although relatively few specific targets have been identified so far. Hypoxia-inducible factor (HIF) was recently shown to regulate the tumorigenic capacity of glioma stem cells under hypoxic conditions. Surprisingly, we found that, under normoxia, HIF1α signaling was selectively activated in the stem cells of mouse lymphoma and human acute myeloid leukemia (AML). HIF1a shRNA and HIF inhibitors abrogated the colony-forming unit (cfu) activity of mouse lymphoma and human AML CSCs. Importantly, the HIF-inhibitor echinomycin efficiently eradicated mouse lymphoma and serially transplantable human AML in xenogeneic models by preferential elimination of CSCs. Hif1α maintains mouse lymphoma CSCs by repressing a negative feedback loop in the Notch pathway. Taken together, our results demonstrate an essential function of Hif1α-Notch interaction in maintaining CSCs and provide an effective approach to target CSCs for therapy of hematological malignancies.


Figures

Fig. 1
Fig. 1
Lymphoma CSC were abrogated by selectively by an HIF inhibitor. a. Selective ablation of lymphoma CFU by echinomycin. The cultured lymphoma cells were treated with given doses of pharmacologically effective drugs in medium for 24 hours prior to CFU assay. Data shown are means +/−SD of triplicates and have been confirmed by 3 independent experiments. b. Constitutive HIF activity among c-Kit+ cells and its sensitivity to echinomycin. The FACS profiles in the upper and middle panels show the specificity of the GFP reporter by co-expression of GFP expressing cells and c-Kit in WT HRE, but not mutant HRE lentiviral reporters. The dose response to inhibition by echinomycin is shown in the bottom panel. The lymphoma cells transfected with the HRE reporter system were cultured in the presence of different concentration of echinomycin for 12 hours, the % of c-Kit+GFP+ cells was normalized against the untreated group (1.13%, which was defined as 100%). The dose that resulted in 50% reduction of the c-Kit+GFP+ cells is defined as IC50. Detailed description of the reporter and its specificity is presented in supplemental data Fig. S3a. c. Selectivity of HIF inhibitor for CFU of lymphoma CSC over the CFU from hematopoietic progenitor cells (HPC). c-Kit+Sca-1+ cells from either TGB or normal bone marrow were treated with given concentration of echinomycin overnight prior to CFU assay. The data shown were % of untreated controls, and were means +/− S.D. of triplicates. d. ShRNA silencing reduces susceptibility of CFU activity to echinomycin. Lymphoma cells were transduced three times with either scrambled vector or Hif1a ShRNA vector and tested their response to inhibition by echinomycin. Note that the ShRNA groups yielded much reduced number CFU activity. For better comparison, CFU activity in the groups that received no echinomycin treatment is defined as 100%. In shRNA group, 100% is defined as 88 (sh1) and 132 (Sh2) CFU per 200,000 cells. In the control group, 100%= 448 CFU per 200,000 cells. e. Echinomycin selectively induces apoptosis of CSC. The cultured lymphoma cells were treated with 20 pM echinomycin or vehicle in medium for 16 hours. The treated cells were stained with c-Kit and Sca-1, followed by staining with Annexin V. f. Therapeutic effect of a low dose of echinomycin. Cultured lymphoma cells (1X10⁶/mouse) were injected i.p. into immune competent B10.BR mice. Fourteen days later, 10μg/Kg/injection of echimomycin was injected at a two-day interval for a total of 5 times. Control mice received vehicle only. The mice were observed daily for survival. Data shown are representative of 2–3 independent experiments. See supplemental Fig. S1 and S2 for characterization of CSC, Fig. S3 for reporter of HIF activity and HIF activity of in vitro propagated and spontaneous lymphoma.
Fig 2
Fig 2
Constitutively active HIF1α is essential for maintenance of CSC. a &b. Gene expression. The cultured lymphoma cells were sorted by BD FACSAria sorting system into c-Kit+Sca-1+ or c-Kit-Sca-1 fractions. The transcripts of HIF1a, HIF2a, HIF3a, Vhl, Glut1 and control gene βactin were determined by RT-PCR. a. Photograph of RT-PCR products. b. Relative expression as measured by real-time PCR. Relative expression of Hif1a, Glut1 and cMyc transcripts in FACS sorted c-Kit+Sca-1+ cells from either TGB tumor (Spl-tumor) or bone marrow (BM). The expression levels were expressed as fractions of house-keeping gene, βactin. c. Selective accumulation of Hif1α protein in the c-Kit+ but not c-Kit TGB tumor cells, as determined by Western blot. The c-Kit+ (purity 83%) and c-Kit (purity 99%) subsets were purified by MAC beads and lysed for Western blot. d. Silencing Hif1a abrogates the c-Kit+Sca-1+ CSC. TGB tumor cells were infected with either lentiviral vector with scrambled shRNA or lentiviral vector expressing two independent shRNA (sh-1 or sh-2). Three days after infection, the bulk tumor cells were analyzed by flow cytometry. The GFPhi and GFPlo cells were gated and analyzed for expression of c-Kit and Sca-1. e. Hif1a shRNA reduces CFU. The cultured lymphoma cells were infected with either lentiviral Hif1a shRNA or scrambled ShRNA by spinoculation, and the infected cells were selected with 5μg/ml of blasticidin for one week. The infected cells were seeded into 1% of methylcellulose culture medium at the density of 2X10⁵/well. The colony numbers were counted under a microscope. Data shown are means +/− SD of colony numbers in triplicates and are representative of three independent experiments. f. Complementation of shRNA-induced defects by human HIF1A cDNA. TGB tumor cells were transduced with either lentiviral vector control or vector encoding human HIF1α protein. After blasticidin selection, the cells were transduced with lentiviral vector deliverying either scrambled shRNA or Hif1a shRNA-1 that has mismatch with human HIF1A. The CFU derived from transduced cells were counted based on expression of EGFP. g. HIF1a shRNAs abrogate tumor-initiating activity. TGB tumor cells were infected 3 times with lentiviral expressing scrambled ShRNA or HIF1α shRNA and then injected into B10.BR mice (9X10⁵/mouse, i.p.). The survival of the recipient mice (n=5) was compared by Kaplan-Meier analysis. All mice that succumbed had developed lymphoma as confirmed by necropsy. All data presented in this figure have been repeated at least twice. See Fig. S5 for lentiviral transduction efficacy.
Fig. 3
Fig. 3
Down-regulation of the Vhl gene is essential for maintenance of CSC. a. Down-regulation of Vhl transcript in c-Kit+Sca-1+ cells. TGB thymoma cells were sorted into c-Kit+Sca-1+ and c-KitSca-1 subsets, as described in Fig. S1, the levels of Vhl transcripts were determined by real-time PCR. b. Ectopic expression of Vhl ablated CSC. TGB tumor cells were infected with either lentiviral vector control, or lentiviral vector expressing Vhl cDNA. Three days after infection, the bulk tumor cells were analyzed by flow cytometry. The GFPhi and GFPlo cells were gated and analyzed for expression of c-Kit and Sca-1. c. Vhl expression reduces tumor CFU. The cultured lymphoma cells were infected with either lentiviral Vhl cDNA or vector by spinoculation, and the infected cells were selected with 5μg/ml of blasticidin for one week. The transduced cells were seeded into 1% of methylcellulose culture medium at a density of 2X10⁵/well. The colony numbers were counted under a microscope. Data shown are means +/− SD of colony numbers in triplicate and are representative of three independent experiments. d. Ectopic expression of Vhl cDNA inhibits tumor-initiating activity. TGB tumor cells were infected 3 times with lentiviral expressing vector alone or Vhl cDNA and then injected into B10.BR mice (9X10⁵/mouse, i.p.). The survival of the recipient mice (n=5) was compared by Kaplan-Meier analysis. The development of lymphoma was confirmed by necropsy. This experiment has been repeated twice.
Fig. 4
Fig. 4
HIF works in concert with Notch pathway to maintain CSC. a. Inhibition of tumor CFU by Notch inhibitor L685458. The cultured lymphoma cells were treated with given doses of L685, 458 for 24 hours and subjected to CFU assay. Data shown are means +/− SD of triplicate samples and are representative of those of at least 3 independent experiments. b. Enhanced Notch activity in CSC, as indicated by the levels of Hes1 transcripts. The lymphoma cells from spleen with TGB tumor were sorted into c-Kit+Sca-1+ or c-Kit-Sca-1 fractions. The expressions of Hes1and mRNA in these two fractions were measured by real time PCR. c. Inhibition of Notch activity by 3 distinct HIF inhibitors. Cultured TGB lymphoma cells were stained with APC conjugated anti-c-Kit- antibody and enriched twice using anti-APC coated MACS beads according to manufacture’s protocol (Militenyi Biotec). The c-kit positive cells-enriched samples (60.4% c-Kit+ cells) were treated with inhibitors of HIF for 16 hours. The mRNA from the treated cells were extracted for PCR. Data shown are means +/− SD of triplicates and represent those from at least 3 independent experiments. 2ME2, 2-methoxyestradiol; GA, geldamycin. d. ShRNA silencing of Hif1a reduced expression of Hes1. TGB tumor cells were transduced with Hif1a shRNA. The transduced cells were selected with blasticidin and were analyzed for Hif1a, Glut1 and Hes1 transcripts by real-time PCR. e–h. A critical role for Notch in maintenance of CSC, as revealed by ectopic expression of Notch I-C dRdA1-42dOP. e. A truncated Notch gene with potent dominant negative activity in inhibiting the expression of Notch target gene Hes1. The upper left panel shows the diagram of the intracellular portion of Notch protein, with the position of RAM, 7 ankyrin repeats (ANK1-7), transcriptional activation domain (TAD), C-terminal OPA (O) and PEST (P) sequence are marked. The lower left panel showed the composition of the dRdA1-4dOP mutant lacking RAM, ANK1-4 and C-terminal O and P sequence, but with insertion of nuclear localization sequence (NLS). The right panel show dominant inhibition of Hes expression. After three consecutive transductions by either vector control or the dRdA1-4dOP mutant, the RNA were isolated and the transcripts of Hes measured by quantitative PCR. Data shown are means of triplicates and have been reproduced by two independent experiments. f. dRdA1-4dOP abrogates the c-Kit+Sca-1+ subset. TGB tumor cells were infected with either lentiviral vector control, or lentiviral vector expressing dRdA1-4dOP. Three days after infection, the bulk tumor cells were analyzed by flow cytometry. The GFPhi and GFPlo cells were gated and analyzed for expression of c-Kit and Sca-1. g. Notch IC- dRdA1-42dOP reduces in vitro self-renewal activity of CSC. The cultured lymphoma cells were infected with either lentiviral vector encoding dRdA1-4dOP or vector control by three consecutive spinoculation. Data shown are the means +/− SD of the colony numbers in triplicate plates, and are representative of those from at least three independent experiments. h. dRdA1-4dOP abrogates tumor-initiating activity. TGB tumor cells were infected 3 times with lentiviral expressing vector alone dRdA1-4dOP and then injected into B10.BR mice (1X10⁶/mouse, i.p.). The survival of the recipient mice was compared by Kaplan-Meier analysis with statistical significance determined by log-rank tests. All mice that died had developed lymphomas. This experiment has been repeated twice. See Fig. S6 for expression of Notch1 and 2 in CSC.
Fig. 5
Fig. 5
HIF1α inhibits negative feedback regulation of Hes1 by preventing Hes1 binding to the N-boxes in the Hes1 promoter. a. Diagram of Hes1 promoter. Detail sequence is provided in supplemental Fig. S6b. b. HIF1α did not cooperate with Notch directly in activating Hes1 promoter. The Hes1 promoter sequence (−225 to +65, TSS as +1) was linked to GFP and transfected into 293 cells in conjunction with vector controls, or vector containing cDNA encoding HIF1α (P402, 564>A, called HIF1α-PA), Notch-IC cDNA or Notch-IC+ HIF1αPA. The promoter activity is measured by the green fluorescence intensity of transfected cells. Data shown were relative intensities. The intensity of Hes1-GFP reporter is defined as 1.0. Transfection efficiency is normalized by co-transfected Renilla lucifease. c. HIF1α partially inhibited Hes1-mediated repression of the Hes1 promoter. As in b, except that the Hes1 or mutant HIF1a cDNA are used. d. HIF1α diminishes the negative auto-regulation of Hes1 expression in Notch signaling. As in b, except different combination of cDNAs were used. Activity of Hes1 reporter in the absence of transfected Hes, HIF1α-PA and Notch is defined as 1.0. e. Competitive inhibition between HIF1αPA and Hes1 to Hes promoter, as revealed by ChIP. cDNAs encoding Flag or Myc-tagged Hes1 and HIF1αPA were transfected into 293 cells. Thirty-six hours after transfection, the transfectants were subject to ChIP analysis. Equal fractions of cells in each group were used for Western blot to confirm essentially identical levels of protein expression when cDNA encoding Hes1 and HIF1αPA were transfected alone or in combination (data not shown). The data present are means+/− S.D. (n=3) of % of input DNA, as measured by real-time PCR using primers marked in Fig. S6b. Data shown are means+/−S.D. of triplicates. The experiments have been repeated at least 3 times. Transfection was performed in 24-well plate for promoter assay or in 6-well plate for CHIP assay. Total DNA amounts used for the transfection are 0.5 μg/per well of 24-well plate and 1.5 μg/per well of 6-well plate. See Fig. S6b for promoter sequence of Hes1, with HRE and N-box and primer sequences marked.
Fig. 6
Fig. 6
HIF1α is a target for therapeutic elimination of human AML in xenogenic mouse model. a. Isolation of 4 subsets of tumor cells in AML samples. Bone marrow cells from AML patient MI-AML-71 were stained for CD34 and CD38 and sorted into 4 subsets for RNA isolation. The presort samples and the gates used for sorting are shown in the left panel and the post-sorted populations are shown in the middle and right panels. The percentages of cells in each gate are provided in the panels. b. Expression of HIF1a (top) and GLUT1 in the subsets. Data shown are means+/−S.D. of transcript levels of the genes, presented as % of βactin from the same samples. Enhanced expression in the CD34+CD38 samples have been observed in all 6 AML samples tested. c. Increased accumulation of HIF1α protein in CD34+CD38 AML cells. CD38+ cells were depleted by negative selection with anti-CD38-conjugated magnetic beads. The remaining cells were further separated into CD38CD34+ (purity 72–78%) and CD38CD34 (purity 96–100%) cells by positive selection, Lysates from the two populations were used for Western blot. d. HIF1α activity is essential for AML-CFU. AML-60 and AML-71 were transduced with either scrambled (Sr) or HIF1a shRNA (Sh-2). The CFU of transduced AML cells were counted based on EGFP signal. The transduction efficacy were measured by FACS prior to plating. The % of GFP+ cells for the experiment were: AML60: Sr, 32.6; Sh-2:32.48. AML-71: Sr: 45.70; Sh-2: 40.19. The shRNA used, Sh-2, targets shared sequenced between mouse and human HIF1a genes. Data showing are CFU per 2x10⁵ cells. e. HIF1a silencing increased the resistance to CFU to echinomycin. As in e, except the transduced cells were treated with given concentration of echinomycin. Data shown were % of CFU after normalized to untreated group (defined as 100%). The number of colonies in the control group are shown in Fig. 6d. Data in d and e have been repeated once with the same conclusions. f. AML-CFU in all 7 AML samples are highly sensitive to echinomycin. AML samples (2.5x10⁵/ml) from either peripheral blood (PB) or bone marrow (BM) were pretreated with given concentrations of echinomycin in 2 ml medium for 24 hours. Treated viable cells were then plated at 105/well for CFU assay in triplicates. The colony numbers were counted 7–10 days later. The data shown are % means+/− S.D. of untreated controls. g. Echinomycin selectively eliminates the CD34+CD38 subset of AML cells. Primary AML samples were thawed from liquid nitrogen. After overnight recovery, they were cultured with given doses of echinomycin or vehicle control for 30 hours in RPMI 1640 containing 10% fetal calf serum and human cytokine cocktail consisting of CSF, GM-CSF and IL-3 at a density of 5X10⁵/ml. The cells were stained with antibodies against CD34, CD38 in conjunction with Annexin V and DAPI. Data shown are the % of Annexin V+DAPI+/− cells with the specified markers. The Annexin V+ cells % in vehicle treated group has been subtracted. The filled symbols show the data for the CD34+CD38 subsets, while the open symbols show data for the bulk leukemia cells (CD34+CD38+ for AML9, AML32, AML60 and AML71 and CD34CD38+ for AML15, AML36 and AML132). These data have been repeated twice. h. Therapeutic effect of human AML in NOD-SCID mice, data shown are % of human CD45 (hCD45)+ cells in the bone marrow of the recipient mice at 40 days after last treatment. The therapeutic effect has been repeated twice. i. Echinomycin does not induce differentiation of AML cells in vivo, as revealed by lack of mature myeloid markers on the bulk of human cells in treated and untreated group. Data shown are profiles of CD14 and CD15 among human CD45+ cells. j. Selective depletion of the CD34+CD38 subset by echinomycin. Data shown in the top panels are the abundance of CD34+CD38 subsets in mouse bone marrow, while the lower panel shows that within human leukemia cells. k. Despite presence of leukemia cells, bone marrow from echinomycin-treated mice failed to reinitiate leukemia in the new NOD-SCID mice. Representative profiles are presented in the top panel, while the summary data from 5 mice per group are presented in the lower panel. See Fig. S7 for the phenotype of AML cells in the xenogeneic model.

Comment in

References

    1. Al-Hajj M, Wicha MS, Benito-Hernandez A, Morrison SJ, Clarke MF. Prospective identification of tumorigenic breast cancer cells. Proc Natl Acad Sci U S A. 2003;100:3983–3988. - PMC - PubMed
    1. Bao S, Wu Q, McLendon RE, Hao Y, Shi Q, Hjelmeland AB, Dewhirst MW, Bigner DD, Rich JN. Glioma stem cells promote radioresistance by preferential activation of the DNA damage response. Nature. 2006;444:756–760. - PubMed
    1. Baumann M, Krause M, Hill R. Exploring the role of cancer stem cells in radioresistance. Nat Rev Cancer. 2008;8:545–554. - PubMed
    1. Beachy PA, Karhadkar SS, Berman DM. Tissue repair and stem cell renewal in carcinogenesis. Nature. 2004;432:324–331. - PubMed
    1. Bonnet D, Dick JE. Human acute myeloid leukemia is organized as a hierarchy that originates from a primitive hematopoietic cell. Nat Med. 1997;3:730–737. - PubMed

Publication types

MeSH terms

Substances