. 2011 Jun 17;286(24):21667-77.
doi: 10.1074/jbc.M110.201582. Epub 2011 Apr 7.

Positive feedback regulation between gamma-aminobutyric acid type A (GABA(A)) receptor signaling and brain-derived neurotrophic factor (BDNF) release in developing neurons

Affiliations

Positive feedback regulation between gamma-aminobutyric acid type A (GABA(A)) receptor signaling and brain-derived neurotrophic factor (BDNF) release in developing neurons

Christophe Porcher et al. J Biol Chem. .

Abstract

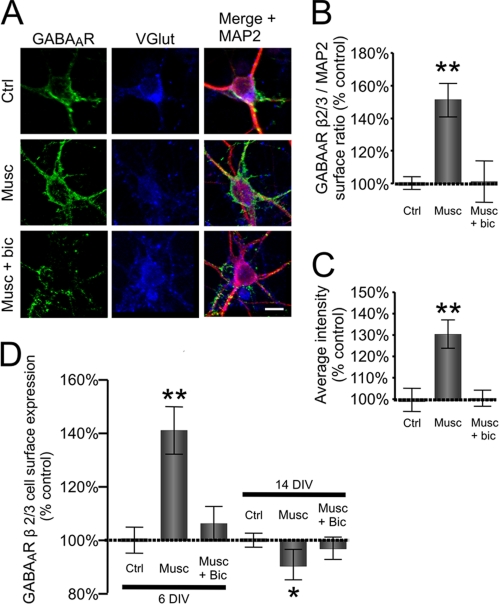
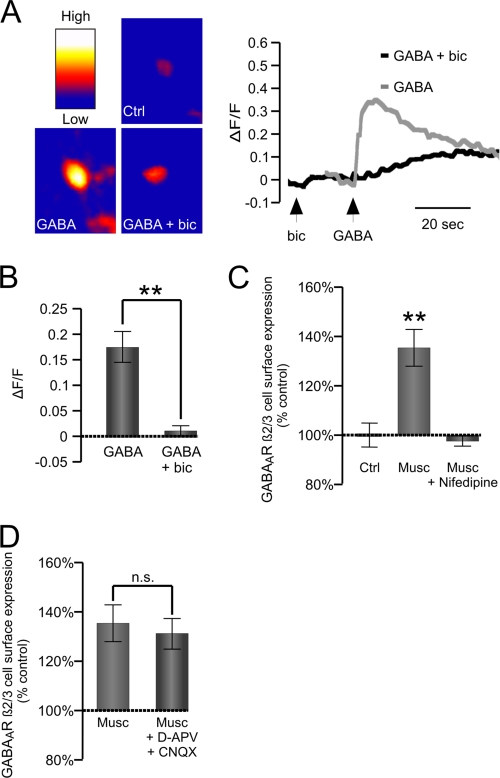
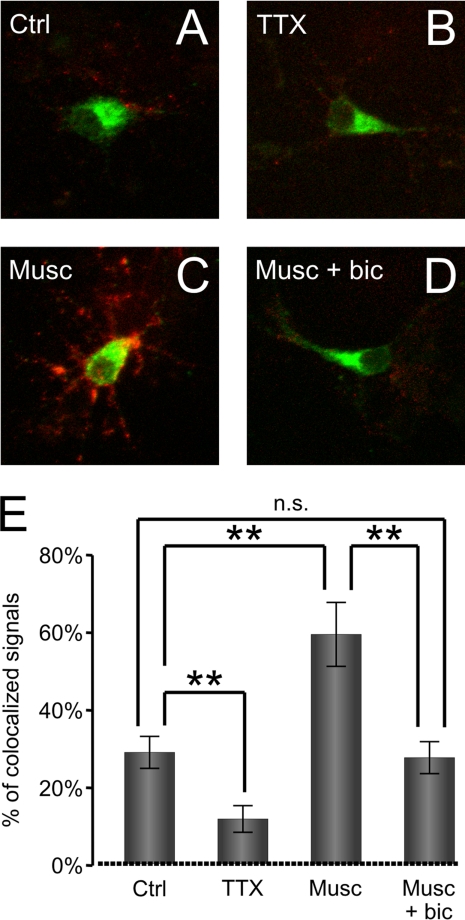
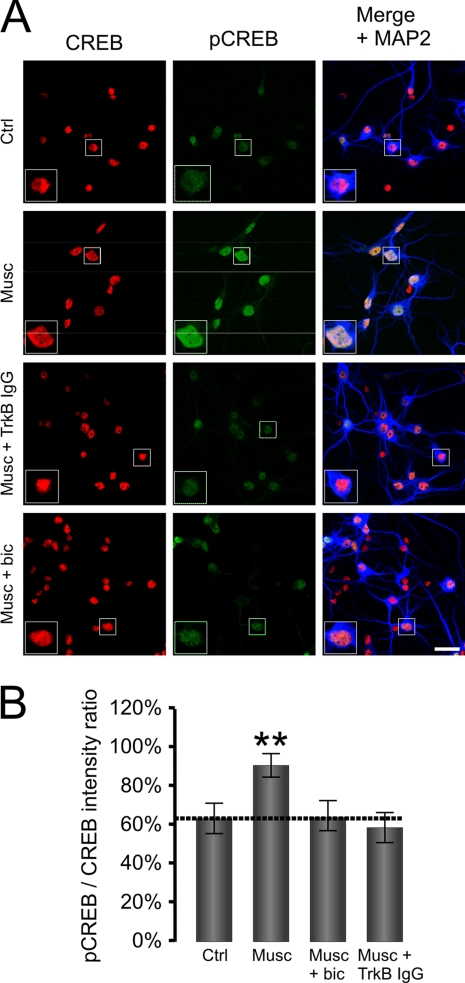
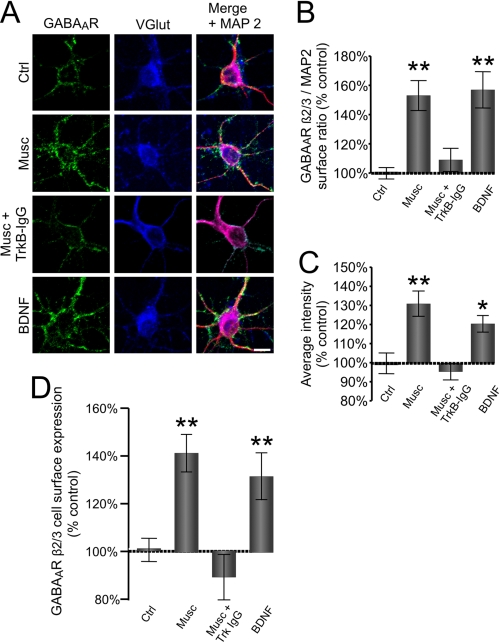
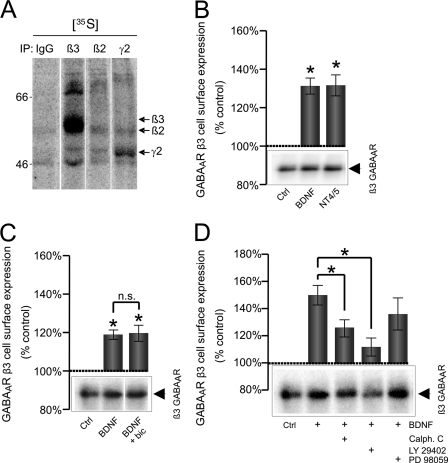
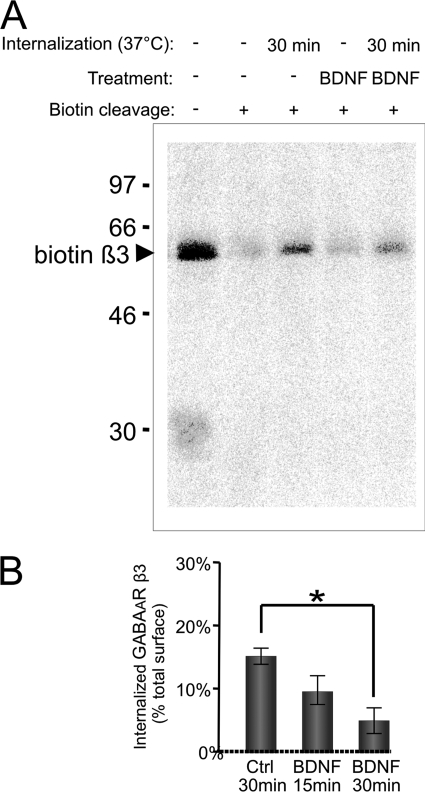
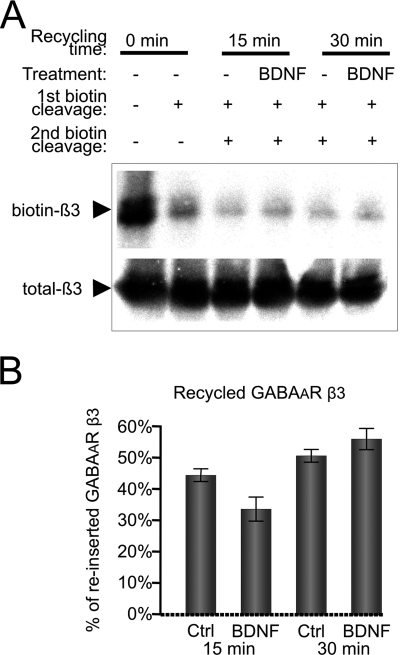
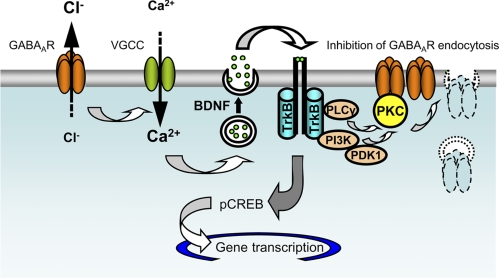
During the early development of the nervous system, γ-aminobutyric acid (GABA) type A receptor (GABA(A)R)-mediated signaling parallels the neurotrophin/tropomyosin-related kinase (Trk)-dependent signaling in controlling a number of processes from cell proliferation and migration, via dendritic and axonal outgrowth, to synapse formation and plasticity. Here we present the first evidence that these two signaling systems regulate each other through a complex positive feedback mechanism. We first demonstrate that GABA(A)R activation leads to an increase in the cell surface expression of these receptors in cultured embryonic cerebrocortical neurons, specifically at the stage when this activity causes depolarization of the plasma membrane and Ca(2+) influx through L-type voltage-gated Ca(2+) channels. We further demonstrate that GABA(A)R activity triggers release of the brain-derived neurotrophic factor (BDNF), which, in turn by activating TrkB receptors, mediates the observed increase in cell surface expression of GABA(A)Rs. This BDNF/TrkB-dependent increase in surface levels of GABA(A)Rs requires the activity of phosphoinositide 3-kinase (PI3K) and protein kinase C (PKC) and does not involve the extracellular signal-regulated kinase (ERK) 1/2 activity. The increase in GABA(A)R surface levels occurs due to an inhibition of the receptor endocytosis by BDNF, whereas the receptor reinsertion into the plasma membrane remains unaltered. Thus, GABA(A)R activity is a potent regulator of the BDNF release during neuronal development, and at the same time, it is strongly enhanced by the activity of the BDNF/TrkB/PI3K/PKC signaling pathway.


Figures

FIGURE 1.
FIGURE 1.
Muscimol-dependent activation of GABAARs leads to increase in cell surface expression of these receptors in developing glutamatergic cerebrocortical neurons. A, cultured neurons (6 DIV) in control conditions (Ctrl) or treated with muscimol (Musc) or muscimol plus bicuculline (Musc + bic) immunolabeled with GABAAR β2,3-subunit-specific mouse monoclonal antibody (MAB 314, bd17) to reveal expression at the cell surface (left panel; green) and, following permeabilization, immunolabeled with anti-VGlut guinea pig antibody (middle panel; blue) and anti-MAP2 rabbit polyclonal antibody (right panel; red) to reveal the intracellular distribution of these proteins. The right panels were obtained by merging GABAAR β2,3, VGlut, and MAP2 labeling. Scale bar, 20 μm. The quantification of the surface GABAAR β2,3/intracellular MAP2 fluorescence ratio (B) and the average intensity of GABAAR β2,3 fluorescence at the cell surface of VGlut-positive cortical neurons (C) treated with muscimol alone (50 μm; 10 min; Musc) or muscimol plus bicuculline (10 μm; 10 min; Musc + bic) in comparison with the vehicle-treated control (Ctrl) is shown. Means ± S.E. are given (25 neurons were analyzed per condition per experiment; n = 3; **, p < 0.001; paired Student's t test). D, cell surface levels of GABAARs measured using ELISA with GABAAR β2,3-subunit specific antibody. Surface levels were obtained from 6- and 14-DIV cultured cortical neurons treated with muscimol alone (50 μm; 10 min; Musc) or in the presence of bicuculline (10 μm; 10 min; Musc + Bic) and expressed as a percentage of vehicle-treated controls. Means ± S.E. are given (n = 4; *, p < 0.05; **, p < 0.001; Student's paired t test). Error bars represent standard error of the mean.
FIGURE 2.
FIGURE 2.
GABAAR-dependent increase in [Ca2+]i is required for increase in cell surface expression. A, representative images of labeled cells (left) and average change in Fluo-4 signal (ΔF/F) produced by bath application of GABA (50 μm; Musc) alone or GABA plus bicuculline (50 μm; GABA + bic) (right). B, graph showing the maximum change in fluorescence in the presence of GABA (ΔF/F; GABA) alone or GABA plus bicuculline (ΔF/F; GABA + bic). Means ± S.E. are given (n = 3; **, p < 0.001; Student's paired t test). C and D, cell surface levels of GABAARs measured using ELISA with GABAAR β2,3-subunit-specific antibody in cultured cortical neurons treated with muscimol alone (50 μm; 10 min; Musc) or in the presence of the L-type VGCC blocker nifedipine (10 μm; 10 min; Musc + Nifedipine) (C) or muscimol alone (50 μm; 10 min; Musc) or in the presence of d-APV and CNQX (10 μm; 10 min; Musc + d-APV + CNQX) (D) and expressed as the percentage of vehicle-treated controls. Means ± S.E. are given (n = 4; **, p < 0.001; Student's paired t test). n.s., not significant; Ctrl, control. Error bars represent standard error of the mean.
FIGURE 3.
FIGURE 3.
GABAAR activation triggers secretion of BDNF-GFP. A–D (top), superimposed images showing the intracellular BDNF-GFP fluorescence (green) and secreted BDNF-GFP detected using anti-GFP antibody (red) under non-permeable conditions in vehicle-treated controls (Ctrl) (A), in the presence of TTX (0.5 μm) (B), in the presence of muscimol (50 μm; Musc) alone (C), or in the presence of muscimol plus bicuculline (10 μm; Musc + bic) (D). E (bottom), quantitative analysis of BDNF-GFP signal bound to the cell surface and overlapping (yellow) with the signal from BDNF-GFP-expressing neurons (green) in vehicle-treated controls (Ctrl) or TTX-, muscimol (Musc)-, or muscimol + bicuculline (Musc + bic)-treated cultures. Means ± S.E. are given (total of 11 cells analyzed per treatment in n = 3 independent experiments; **, p < 0.001; Student's independent t test). n.s., not significant. Error bars represent standard error of the mean.
FIGURE 4.
FIGURE 4.
GABAAR activation induces BDNF/TrkB-dependent phosphorylation of CREB. A, immunofluorescence of CREB (left panels; red) and pCREB (middle panels; green) in cortical neurons in control conditions (Ctrl) or treated with muscimol alone (50 μm; Musc), muscimol plus TrkB-IgG (2 μg/ml; Musc + TrkB IgG), or muscimol plus bicuculline (10 μm; Musc + bic). Merged images with MAP2 staining (blue) are shown on the right. Scale bar, 20 μm. B, average pCREB/CREB ratio in four different conditions. Means ± S.E. are given (total of 12–17 cells analyzed per treatment in n = 3 independent experiments; **, p < 0.001; Student's independent t test). Error bars represent standard error of the mean.
FIGURE 5.
FIGURE 5.
GABAAR-dependent release of endogenous BDNF mediates increase in cell surface expression. A, cultured cerebrocortical neurons (6 DIV) in control conditions (Ctrl) or treated with muscimol in the absence (Musc) or presence of TrkB-IgG (Musc + TrkB-IgG) or with the exogenous BDNF (100 ng/ml). Neurons were immunolabeled with GABAAR β2,3-subunit-specific mouse monoclonal antibody (MAB 314, bd17) (left panel; green) to reveal expression at the cell surface and, following permeabilization, immunolabeled with anti-VGlut guinea pig antibody (middle panel; blue) or anti-MAP2 rabbit polyclonal antibody (right panel; red) to reveal the intracellular distribution of these proteins. The right panels were obtained by merging GABAAR β2,3, VGlut, and MAP2 labeling. Scale bar, 20 μm. The quantification of the surface GABAAR β2,3/intracellular MAP2 fluorescence ratio (B) and the average intensity of GABAAR β2,3 fluorescence (C) at the surface of VGlut-positive neurons treated with vehicle (Ctrl), muscimol alone (50 μm; 10 min; Musc), with muscimol plus TrkB-IgG (10 μm; 10 min; Musc + TrkB IgG), or with the exogenous BDNF. Means ± S.E. are given (25 neurons were analyzed per condition per experiment; n = 3; *, p < 0.05; **, p < 0.001; Student's paired t test). D, cell surface levels of GABAARs measured using ELISA with GABAAR β2,3-subunit specific antibody in neurons treated with muscimol alone (50 μm; 10 min; Musc), with muscimol plus TrkB-lgG (10 μm; 10 min; Musc + TrkB-lgG), or with the exogenous BDNF (100 ng/ml) and expressed as a percentage of vehicle-treated controls. Means ± S.E. are given (n = 3; **, p < 0.001; Student's paired t test). Error bars represent standard error of the mean.
FIGURE 6.
FIGURE 6.
BDNF-dependent increase in cell surface expression of GABAA receptor β3-subunit is mediated by PI 3-kinase and PKC signaling pathways. A, [35S]methionine labeling of cortical neurons and immunoprecipitation (IP) with control rabbit IgG or antibodies specific for the β3-, β2-, or γ2-subunit of GABAARs. Arrows indicate migration of individual GABAAR subunits. Cortical neurons were treated with vehicle (Ctrl), BDNF (100 ng/ml), or neurotrophin 4/5 (100 ng/ml; NT4/5) (B); with vehicle (Ctrl), BDNF alone, or BDNF plus bicuculline (BDNF + bic) (C); and with vehicle (Ctrl), BDNF alone, BDNF plus calphostin C (Calph. C; 0.5 μm), BDNF plus LY 294002 (2 μm), or BDNF plus PD 98059 (50 μm) (D). These treatments were followed by biotinylation of cell surface proteins using sulfo-NHS-SS-biotin (1 mg/ml) and precipitation using NeutrAvidin-agarose. Protein samples were resolved by SDS-PAGE, and the amount of biotinylated β3-subunit was determined by quantitative immunoblotting with a specific antibody followed by 125I-conjugated secondary antibody and analysis using a phosphorimaging system. Means ± S.E. are given (n = 3–4; *, p < 0.05; Student's paired t test). n.s., not significant. Error bars represent standard error of the mean.
FIGURE 7.
FIGURE 7.
BDNF-dependent decrease in endocytosis of GABAARs. Cell surface proteins were biotinylated using sulfo-NHS-SS biotin (1 mg/ml) at 4 °C followed by incubation at 37 °C in the absence (Ctrl) or presence of BDNF for 15 or 30 min. Control biotinylated samples that were not incubated at 37 °C but kept at 4 °C were processed in parallel. Residual biotin was removed from the cell surface with reduced glutathione, cells were lysed, and biotinylated proteins were precipitated using NeutrAvidin-agarose. Protein samples were resolved by SDS-PAGE, and the amount of endocytosed GABAAR β3-subunit was determined by quantitative immunoblotting with a specific antibody followed by incubation with 125I-conjugated secondary antibody and analysis using a phosphorimaging system. A, representative immunoblot. B, quantification of GABAAR endocytosis. Means ± S.E. are given (n = 4; *, p < 0.05; Student's paired t test). Error bars represent standard error of the mean.
FIGURE 8.
FIGURE 8.
Recycling of endocytosed GABAA receptors is not regulated by BDNF. Cell surface proteins were first biotinylated using sulfo-NHS-SS biotin (1 mg/ml) at 4 °C and then incubated at 37 °C for 30 min to allow endocytosis to occur. After removing residual biotin from the cell surface with reduced glutathione (first cleavage), cells were incubated in the absence (Ctrl) or presence of BDNF for 15 or 30 min to allow reinsertion into the plasma membrane followed by a second round of biotin cleavage from the cell surface with glutathione. Cells were lysed, and residual biotinylated proteins were precipitated using NeutrAvidin-agarose. Protein samples were resolved by SDS-PAGE, and the amount of endocytosed GABAAR β3-subunit was determined by quantitative immunoblotting with a specific antibody followed by incubation with 125I-conjugated secondary antibody and analysis using a phosphorimaging system. A, representative immunoblot. B, quantification of biotinylated GABAARs that were reinserted into the plasma membrane. Means ± S.E. are given (n = 4; Student's paired t test). Error bars represent standard error of the mean.
FIGURE 9.
FIGURE 9.
Positive feedback mechanisms operating between GABAAR activity and BDNF release in developing cerebrocortical neurons. Activation of GABAARs leads to a depolarization of the plasma membrane, activation of VGCCs, and Ca2+-dependent release of BDNF. BDNF activates TrkB receptors and, via downstream signaling pathways mediated by PI 3-kinase and PKC, leads to an inhibition of GABAAR endocytosis and a consequent increase in the cell surface expression of these receptors. PLC, phospholipase C.

Similar articles

Cited by

References

    1. Farrant M., Kaila K. (2007) Prog. Brain Res. 160, 59–87 - PubMed
    1. Whiting P. J., Bonnert T. P., McKernan R. M., Farrar S., Le Bourdellès B., Heavens R. P., Smith D. W., Hewson L., Rigby M. R., Sirinathsinghji D. J., Thompson S. A., Wafford K. A. (1999) Ann. N.Y. Acad. Sci. 868, 645–653 - PubMed
    1. LoTurco J. J., Owens D. F., Heath M. J., Davis M. B., Kriegstein A. R. (1995) Neuron 15, 1287–1298 - PubMed
    1. Haydar T. F., Wang F., Schwartz M. L., Rakic P. (2000) J. Neurosci. 20, 5764–5774 - PMC - PubMed
    1. Behar T. N., Li Y. X., Tran H. T., Ma W., Dunlap V., Scott C., Barker J. L. (1996) J. Neurosci. 16, 1808–1818 - PMC - PubMed

Publication types

LinkOut - more resources