. 2011 Jun 9;117(23):6202-13.
doi: 10.1182/blood-2010-06-292243. Epub 2011 Apr 7.

Integrin β7-mediated regulation of multiple myeloma cell adhesion, migration, and invasion

Affiliations

Integrin β7-mediated regulation of multiple myeloma cell adhesion, migration, and invasion

Paola Neri et al. Blood. .

Erratum in

Abstract

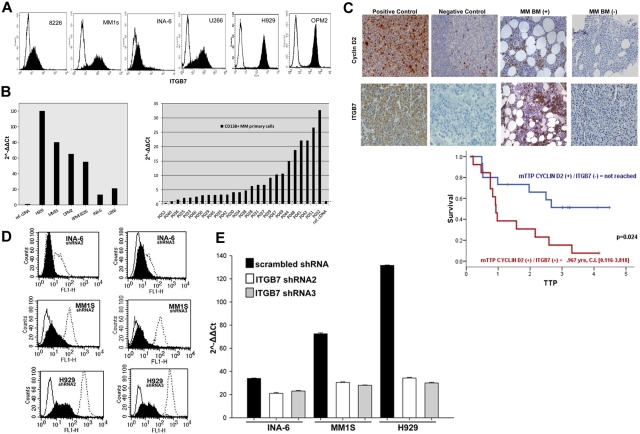
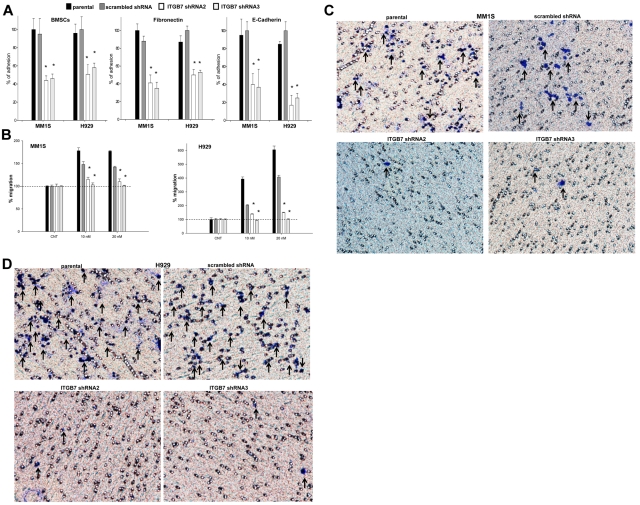
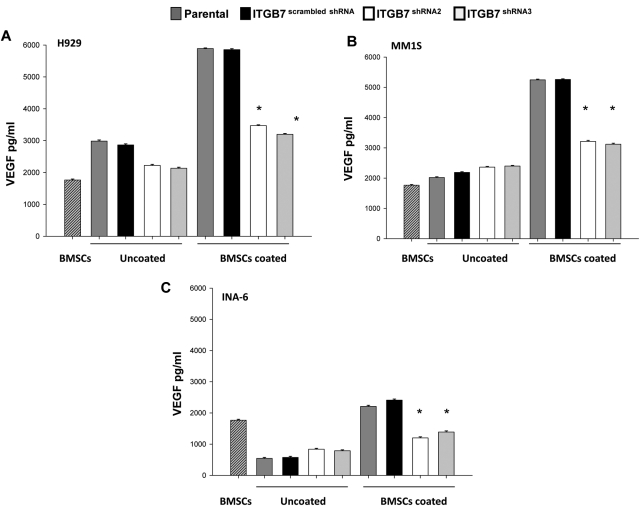
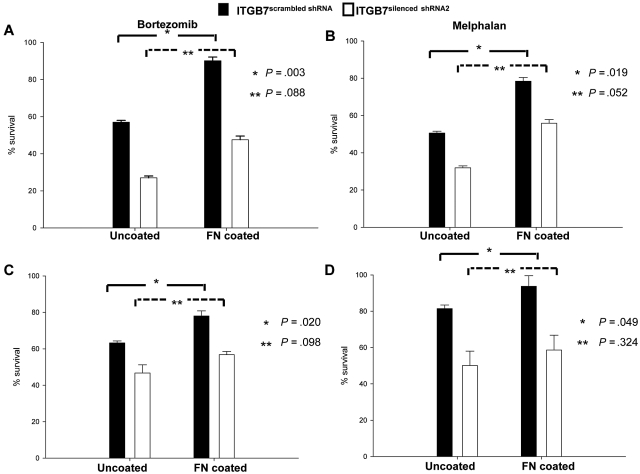
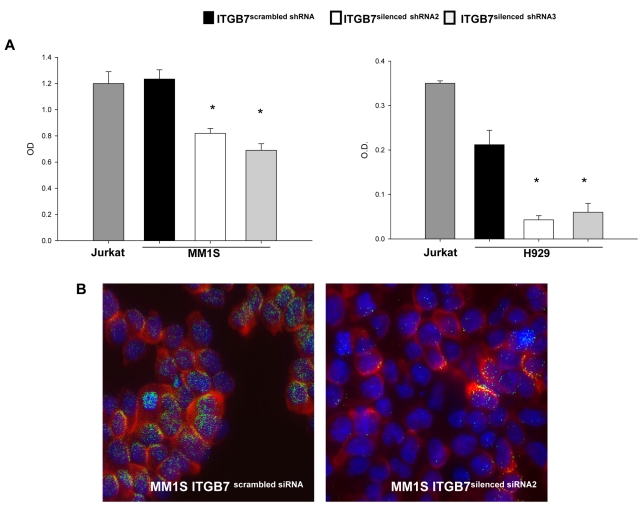
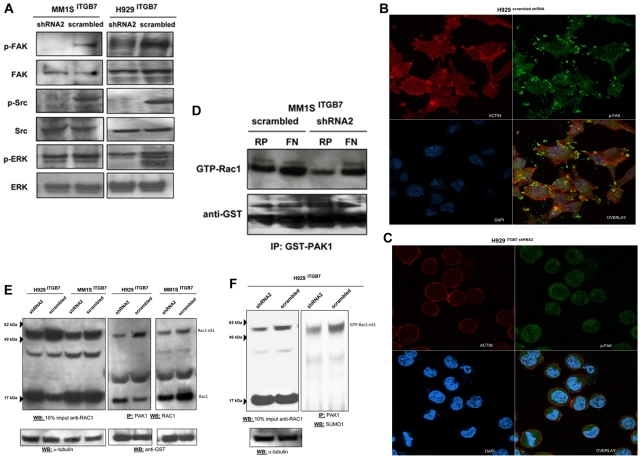
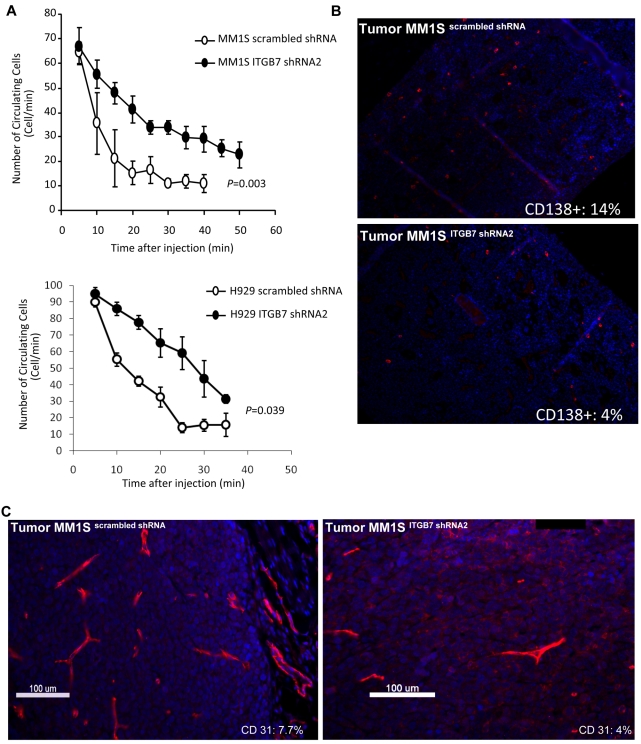
Integrin-β7 (ITGB7) mRNA is detected in multiple myeloma (MM) cells and its presence is correlated with MAF gene activation. Although the involvement of several integrin family members in MM-stoma cell interaction is well documented, the specific biologic functions regulated by integrin-β7 in MM are largely unknown. Clinically, we have correlated integrin-β7 expression in MM with poor survival outcomes post autologous stem cell transplantation and postsalvage therapy with bortezomib. Functionally, we have found that shRNA-mediated silencing of ITGB7 reduces MM-cell adhesion to extra-cellular matrix elements (fibronectin, E-cadherin) and reverses cell-adhesion-mediated drug resistance (CAM-DR) sensitizing them to bortezomib and melphalan. In addition, ITGB7 silencing abrogated MM-cell transwell migration in response to SDF1α gradients, reduced vessel density in xenografted tumors, and altered MM cells in vivo homing into the BM. Mechanistically, ITGB7 knockdown inhibited focal adhesion kinase (FAK) and Src phosphorylation, Rac1 activation, and SUMOylation, reduced VEGF production in MM-BM stem cell cocultures and attenuated p65-NF-κB activity. Our findings support a role for integrin-β7 in MM-cell adhesion, migration, and BM homing, and pave the way for a novel therapeutic approach targeting this molecule.


Figures

Figure 1
Figure 1
Integrin-β7 expression in myeloma cell lines and primary myeloma cells. (A) Flow cytometric analysis demonstrating integrin-β7 expression in MM cell lines (OPM2, INA6, MM1S, 8226, H929, and U266). Open histograms represent isotype IgG1 control, whereas solid histograms indicate integrin-β7 staining. (B) ITGB7 mRNA expression as determined by quantitative RT-PCR in indicated MM cell lines and CD138+ sorted cells from the BM aspirates of MM patients. Data quantification was carried out by the 2−ΔΔct method relative to a reference human cDNA library (Stratagene). (C) Myeloma tissue microarray (TMA) constructed from the BM biopsies of 79 newly diagnosed MM patients was used to evaluate the expression of integrin-β7 and Cyclin D2 by immunohistochemical staining (IHC) and its impact on prognosis. Shown in the insets are representative H&E, Cyclin D2, and integrin-β7 staining of MM patients BM biopsies. Also shown, positive and negative controls (Cyclin D2: positive OPM2 myeloma cell line; negative: human tonsils; Integrin-β7: positive MM1S myeloma cell line; negative: HL60 leukemia cell line). Images were acquired with a bright light Olympus BX5 microscope and multispectral camera (Nuance Fx; CRi) 10× magnification. Kaplan-Meier survival curves indicate the shorter time to progression (TTP) for patients with MM cells coexpressing Cyclin D2 and integrin-β7. (D) ITGB7 silencing with lentiviral mediated delivery of ITGB7-specific shRNAs (shRNA 2 and 3) in MM1S, H929 and INA-6 cells. Shown is integrin-β7 expression in puromycin-selected cells transfected with ITGB7-specific shRNAs (solid histogram: ITGB7silenced) or scrambled oligonucleotides sequences (open histogram, dashed line: ITGB7positive) relative to control IgG1 istoype (open histogram, solid line) as determined by flow cytometry. (E) qRT-PCR confirming ITGB7 silencing in established puromycin-resistant ITGB7silenced versus ITGB7positive cells.
Figure 2
Figure 2
Effects of ITGB7 silencing on adhesion, migration, and invasion of MM cells. (A) Adhesion of calcein-AM–labeled ITGB7silenced (ITGB7 shRNA2 and ITGB7 shRNA3) versus ITGB7positive (scrambled shRNA) and parental (nontransfected) MM1S and H929 cells to BMSCs, FN, and E-CDH–coated 96-well microplates. Unattached cells were washed and adherent cells were measured in a fluorescence plate reader. Data are presented as percentage of respective controls (mean ± SD of triplicates from 3 independent experiments). (B) Transwell migration (8-μm pores; Costar) of calcein-AM–labeled ITGB7silenced (ITGB7 shRNA2 and ITGB7 shRNA3) vs ITGB7positive (scrambled shRNA) and parental (nontransfected) MM1S and H929 cells to RPMI serum-free media (cnt) or RPMI supplemented with SDF-1α (10 and 20nM). The fluorescence values, quantitated in a fluorescence multiwell plate reader using the 494/517nM filter set; percentage of migrating cells to SDF-1α versus control (serum-free RPMI) are shown. Data are presented as the mean ± SD of triplicates from 3 independent experiments. (C-D) Shown is a representative transwell Matrigel invasion of ITGB7silenced (ITGB7 shRNA2 and ITGB7 shRNA3) vs ITGB7positive (scrambled shRNA) and parental (nontransfected) MM1S and H929 cells under the conditions described in “Transwell migration assay and invasion studies.” Cells that invaded the Matrigel-coated filters are stained with crystal violet and counted using an inverted microscope. Images were acquired with a bright light Olympus BX5 microscope and multispectral camera (Nuance FX; CRi). 40× magnification.
Figure 3
Figure 3
Effects of ITGB7 silencing on cytokines production in MM-BMSC cocultures. (A-C) ITGB7silenced (ITGB7 shRNA2 and ITGB7 shRNA3) vs ITGB7positive (scrambled shRNA) and parental (nontransfected) H929 and INA-6 MM cells were added into 96-well plates coated with BMSCs or uncoated plates and incubated at 37°C for 48 hours. Supernatant was collected and assayed for VEGF by ELISA-based assay. Data are presented as the mean ± SD of triplicates from 2 independent experiments.
Figure 4
Figure 4
ITGB7 silencing reverses CAM-DR to bortezomib and melphalan. (A-D) ITGB7silenced and ITGB7positive H929 (A-B) and MM1S (C-D) were incubated in 96 well-uncoated or FN-coated plates and cultured for 24 hours in the absence and presence of bortezomib (2.5nM; A,C) or melphalan (20mM; B,D). Annexin V staining was used to evaluate the cytotoxic effects of these agents under the indicated conditions. Shown are the mean ± SD of triplicates from 3 independent experiments (*P < .05; **P > .05).
Figure 5
Figure 5
ITGB7 silencing reduces p65 NF-κB activity in MM cells. (A) NF-κB-p65 transcription factor binding to its consensus sequence on a plate-bound oligonucleotide was measured by ELISA in nuclear extracts from Jurkat, ITGB7silenced (ITGB7 shRNA2 and ITGB7 shRNA3), and ITGB7positive (scrambled shRNA) MM1S and H929 cells cultured on FN-coated plates. Shown results represent means (± SD) of triplicate experiments (* P < .05). (B) Decreased nuclear NF-κB-p65 translocation or localization in ITGB7silenced (right) compared with ITGB7positive (left) MM1S cells cultured on FN-coated plates as detected by immunofluorescence staining with p65 NF-kB Ab (Cy-3 labeled) and DAPI for nuclear visualization. Image acquisition was performed with epifluorescence Olympus BX5 microscope and multispectral color camera (Nuance FX; CRi) with 60× magnification and oil immersion (details in supplemental Materials).
Figure 6
Figure 6
ITGB7 binding to FN activates FAK, Src, and Rac-1. (A) Lysates from ITGB7silenced and ITGB7positive MM1S and H929 cells cultured on FN were screened by immunoblotting for the activation of FAK (phospho-Tyr397-FAK), Src (phospho-Tyr416-Src), and ERK (phospho-Thr202/Tyr204ERK1/2) and loading controls. (B-C) p-FAK localization and distribution in ITGB7positive (B) and ITGB7silenced (C) H929 cell cultures on FN-coated plates and measured by laser scan confocal microscopy. Shown are the images of immunostaining with anti-actin (Red: AlexaFluor 555 phalloidin), anti-phospho-FAK (Green: AlexaFluor 488) and DAPI with overlay images. (D) Rac-1 activation (GTP-Rac1 bound to GST-PAK1-p21-binding domain corresponding to residues 67-150) measured by immunoblotting with Rac-1 Ab on GST-PAK1 immunoprecipitated protein lysates (500 μg) from ITGB7silenced and ITGB7positive MM1S cells cultured under the indicated conditions (RP = regular uncoated plate, FN = fibronectin-coated plates) with anti-GST (Cell Signaling Technology) loading control. (E) Activation of Rac1 was measured in lysates from ITGB7silenced and ITGB7positive MM1S and H929 cells cultured on FN. Pulldowns of activated Rac1 (GTP-Rac1 bound to GST-PAK1 beads) were analyzed by Western blot for Rac1 and reprobed with anti-GST as loading control. Blot on the left represent a Western blot for total Rac1 in 10% of the imput lysate used for the immunoprecipiation of activated Rac1. Rac1-nS1 indicates the up-shifted band of Rac1 corresponding to SUMOylated Rac1. (F) Pulldowns of activated Rac1 (GTP-Rac1 bound to GST-PAK1 beads) from H929 ITGB7silenced and ITGB7positive cells cultured on FN were blotted with anti-SUMO1 Ab. Blot on the left represent a Western blot for total Rac1 in 10% of the input lysate used for IP. GTP-Rac1-nS1 indicates the up-shifted band of Rac1 corresponding to SUMOylated Rac1.
Figure 7
Figure 7
ITGB7 silencing reduces in vivo MM-cell extravasation and homing to the BM and decreases xenografted tumors vessel density. (A) ITGB7 silencing significantly reduced in vivo MM-cell homing after BALB/c mice tail vein injection, as detected by in vivo flow cytometry and monitoring the number of circulating calcein-AM–labeled ITGB7silenced (●) and ITGB7positive (○) MM1S and H929 cells over time. (B) Direct homing of CD138+ ITGB7silenced (bottom) and ITGB7positive (top) MM1S cells to the BM was detected by IF staining with anti–human CD138-Cy3 labeled Ab and DAPI in mice femoral BM sections, as described in “Methods.” Shown in the inset is the mean ± SD of the percentage of human-CD138+ cells (red: Cy-3) in 500 BM cells counted in bilateral femoral sections from killed SCID mice (n = 3 per condition) (10×). (C) Effect of ITGB7 silencing on microvessel density measured by CD31 staining (Cy-3: red) in ITGB7silenced (right) and ITGB7positive (left) MM1S xenografted tumors (40×). Shown in the inset is the MVD (%) = CD31+ target area/total area examined as described in “Methods.” Images were aquired with an epifluorescence Olympus BX5 microscope and multispectral camera (Nuance Fx; CRi). Automated scaling of fluoresence was performed with the inForm™ analysis software (CRi).

References

    1. Richardson PG, Sonneveld P, Schuster MW, et al. Bortezomib or high-dose dexamethasone for relapsed multiple myeloma. N Engl J Med. 2005;352(24):2487–2498. - PubMed
    1. Dimopoulos M, Spencer A, Attal M, et al. Lenalidomide plus dexamethasone for relapsed or refractory multiple myeloma. N Engl J Med. 2007;357(21):2123–2132. - PubMed
    1. Chauhan D, Uchiyama H, Akbarali Y, et al. Multiple myeloma cell adhesion-induced interleukin-6 expression in bone marrow stromal cells involves activation of NF-kappa B. Blood. 1996;87(3):1104–1112. - PubMed
    1. Podar K, Tai YT, Davies FE, et al. Vascular endothelial growth factor triggers signaling cascades mediating multiple myeloma cell growth and migration. Blood. 2001;98(2):428–435. - PubMed
    1. Damiano JS, Cress AE, Hazlehurst LA, Shtil AA, Dalton WS. Cell adhesion mediated drug resistance (CAM-DR): role of integrins and resistance to apoptosis in human myeloma cell lines. Blood. 1999;93(5):1658–1667. - PMC - PubMed

Publication types

MeSH terms

Substances