. 2011 May 23;51(5):1132-50.
doi: 10.1021/ci200055s. Epub 2011 Apr 8.

Rigorous treatment of multispecies multimode ligand-receptor interactions in 3D-QSAR: CoMFA analysis of thyroxine analogs binding to transthyretin

Affiliations

Rigorous treatment of multispecies multimode ligand-receptor interactions in 3D-QSAR: CoMFA analysis of thyroxine analogs binding to transthyretin

Senthil Natesan et al. J Chem Inf Model. .

Abstract

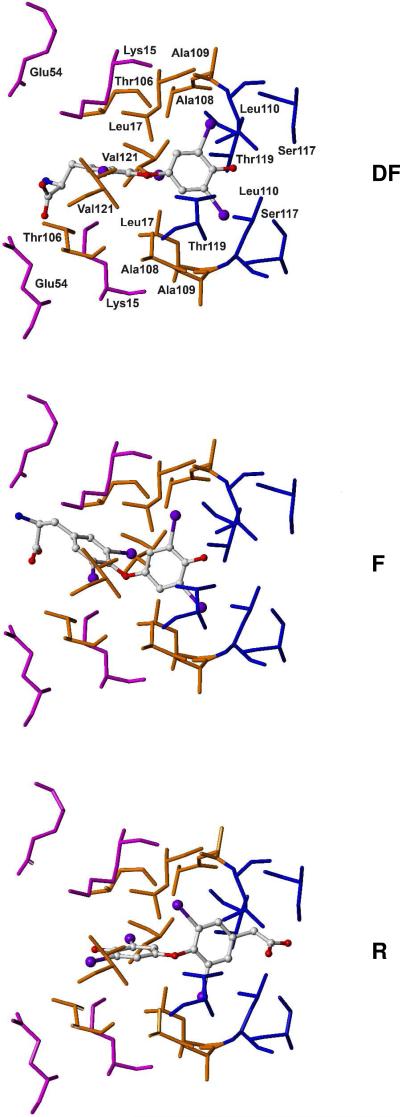
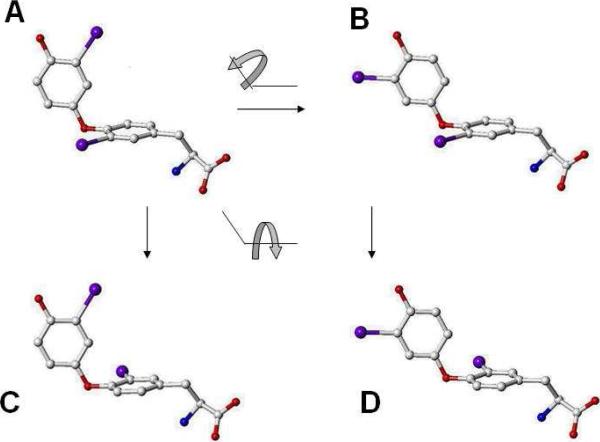
For a rigorous analysis of the receptor-ligand binding, speciation of the ligands caused by ionization, tautomerism, covalent hydration, and dynamic stereoisomerism needs to be considered. Each species may bind in several orientations or conformations (modes), especially for flexible ligands and receptors. A thermodynamic description of the multispecies (MS), multimode (MM) binding events shows that the overall association constant is equal to the weighted sum of the sums of microscopic association constants of individual modes for each species, with the weights given by the unbound fractions of individual species. This expression is a prerequisite for a precise quantitative characterization of the ligand-receptor interactions in both structure-based and ligand-based structure-activity analyses. We have implemented the MS-MM correlation expression into the comparative molecular field analysis (CoMFA), which deduces a map of the binding site from structures and binding affinities of a ligand set, in the absence of experimental structural information on the receptor. The MS-MM CoMFA approach was applied to published data for binding to transthyretin of 28 thyroxine analogs, each forming up to four ionization species under physiological conditions. The published X-ray structures of several analogs, exhibiting multiple binding modes, served as templates for the MS-MM superposition of thyroxine analogs. Additional modes were generated for compounds with flexible alkyl substituents, to identify bound conformations. The results demonstrate that the MS-MM modification improved predictive abilities of the CoMFA models, even for the standard procedure with MS-MM selected species and modes. The predicted prevalences of individual modes and the generated receptor site model are in reasonable agreement with the available X-ray data. The calibrated model can help in the design of inhibitors of transthyretin amyloid fibril formation.


Figures

Figure 1
Figure 1
Heavy-atom connectivity and numbering of the skeleton of studied thyroxine analogs. The conformation of the diphenyl ether skeleton is defined by dihedrals Φ1 (C3-C4-O4-Cl') and Φ2 (C4-O4-C1'-C2'). The amino acid side chain conformation is given by dihedrals Φ3 (C2-C1-C7-C8), Φ4 (C1-C7-C8-N8), and Φ5 (N8-C8-C9-O10).
Figure 2
Figure 2
Two thyroxine molecules bound in the deep forward orientation (see below) at two opposite binding sites of transthyretin (PDB code 1ICT). The transthyretin tetramer is shown as α-carbon wire with the subunits labeled and thyroxine molecules are shown in space-fill rendering. The affinities of the two binding sites are widely different due to negative cooperativity.
Figure 3
Figure 3
Deep Forward (DF), forward (F), and reversed (R) binding orientations of thyroxine to transthyretin as observed in the PDB files 1ICT, 2ROX, and 1Z7J, respectively. The colors indicate the binding pockets: inner (blue), middle (orange), and outer (magenta). For illustration the residues of 1ICT are shown in all cases (capped sticks). Thyroxine is depicted as atom-colored balls and sticks.
Figure 4
Figure 4
Four skeleton conformations of studied ligands, illustrated using 3,3’-diodo-L-thyronine (compound 19, Table 1), derived from crystallographic conformation (conformation A, PDB file 1THA). Conformation B was obtained by flipping the phenolic ring by 180°; conformation C results from flipping the tyrosine ring by 180°; and conformation D was generated by flipping both phenolic and tyrosine rings by 180°. Atom color coding: carbon – grey, nitrogen – blue, oxygen – red, iodine – purple.
Figure 5
Figure 5
Multiple analyzed conformations of isobutyl, n-propyl, s-butyl, and benzyl substituents in compounds 3, 5, 6, and 10, respectively. Conformations are named as extended (e1 - blue, e2 – magenta) and folded (f1 – orange, f2 – green).
Figure 6
Figure 6
Generation of multiple modes: (a) superposition of the complex structures (PDB files 1THA, 2ROX and 1Z7J), containing three binding orientation templates (DF orientation in magenta, F orientation in cyan, and R orientation in orange; the binding site amino acids in atom colors); (b) the three extracted templates; (c) the four skeleton conformations A, B, C, and D for the DF orientation, shown for 3,3’-diiodo-L-thyronine (19 in Table 1). Similar skeleton conformations were constructed for F and R orientations. Additional conformations were generated for alkyl-substituted compounds 3, 5, 6, and 10, to accommodate the increased potential for multiple binding modes of alkyl chains.
Figure 7
Figure 7
Superpositions for the forward orientation in (a) the multi-mode situation (156 structures arising from 24 ligands in 4 modes, 1 ligand in 12 modes, and 3 ligands in 16 modes) and (b) the one-mode situation (28 stuctures). For multiple species, the results are similar, because the species differ essentially only in the presence of hydrogens. To generate overall superpositions, similar setups for the deep-forward and reverse orientations (Figures 4 and 6) were added.
Figure 8
Figure 8
Experimental data vs. calculated binding affinities for the training set (a) and predicted binding affinities for the test set (b). Multi-species, multi-mode model (black points), single-species, multi-mode model (red), single-species, single-mode (the most preferred modes from MS-MM model) (green), and single-species, single-mode (forward mode - blue).
Figure 9
Figure 9
Correlation of bound species prevalence and species fraction in the aqueous solution for studied ligands (the numbers correspond to those in Table 1). Species 1, 2, 3, and 4 (defined in Table 2) are referred to by black, red, green and blue colors, respectively.
Figure 10
Figure 10
Contour map of the multi-species, multi-mode model. Green and yellow contours mark sterically favorable and unfavorable regions, respectively. In red and blue regions, positive and negative charges are favored, respectively. Key residues of the binding site are colored by atom type.

Similar articles

Cited by

References

    1. Hilal SH, Bornander LL, Carreira LA. Hydration equilibrium constants of aldehydes, ketones and quinazolines. QSAR & Combinatorial Science. 2005;24:631–637.
    1. Davies NM. Chiral inversion. Chirality Drug Des. Dev. 2004:351–392.
    1. Mattos C, Ringe D. Multiple binding modes. In: Kubinyi Hugo., editor. 3D QSAR in Drug Design: Theory, Methods, and Applications. Escom; Leiden: 1993. pp. 226–254.
    1. Case DA, Karplus M. Dynamics of ligand binding to heme protein. J. Mol. Biol. 1979;132:343–368. - PubMed
    1. Nelson RD, Gottlieb DI, Balasubramanian TM, Marshall GR. Opioid peptides: analysis of specificity and multiple binding modes through computer-aided drug design and structure-activity studies. NIDA Res. Monogr. 1986;69:204–230. - PubMed

Publication types