

Digital isothermal quantification of nucleic acids via simultaneous chemical initiation of recombinase polymerase amplification reactions on SlipChip
- PMID: 21476587
- PMCID: PMC3101872
- DOI: 10.1021/ac200247e
Digital isothermal quantification of nucleic acids via simultaneous chemical initiation of recombinase polymerase amplification reactions on SlipChip
Abstract
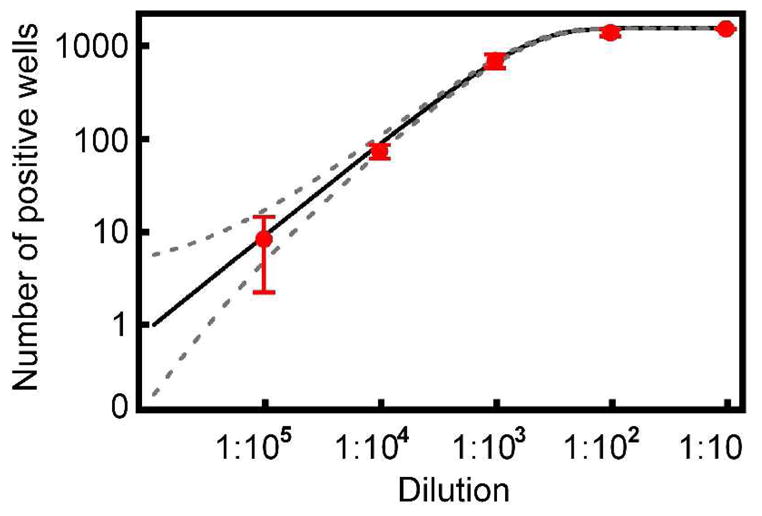
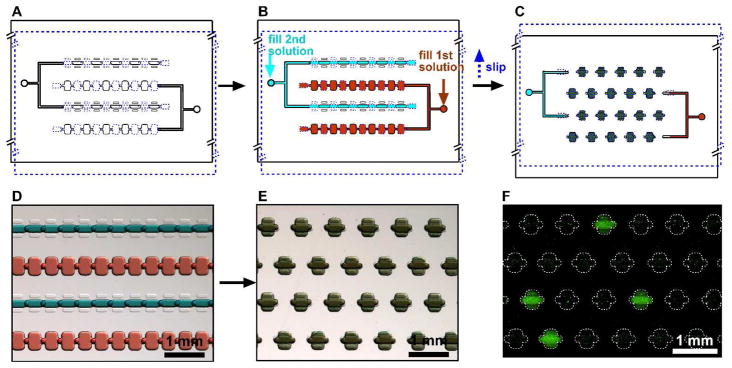
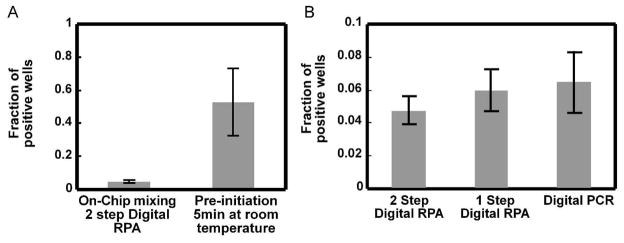
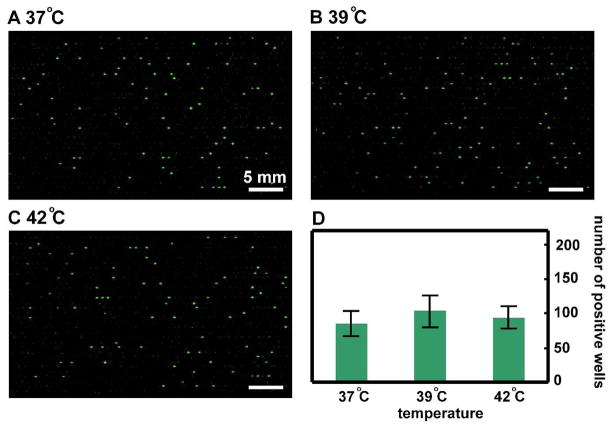
In this paper, digital quantitative detection of nucleic acids was achieved at the single-molecule level by chemical initiation of over one thousand sequence-specific, nanoliter isothermal amplification reactions in parallel. Digital polymerase chain reaction (digital PCR), a method used for quantification of nucleic acids, counts the presence or absence of amplification of individual molecules. However, it still requires temperature cycling, which is undesirable under resource-limited conditions. This makes isothermal methods for nucleic acid amplification, such as recombinase polymerase amplification (RPA), more attractive. A microfluidic digital RPA SlipChip is described here for simultaneous initiation of over one thousand nL-scale RPA reactions by adding a chemical initiator to each reaction compartment with a simple slipping step after instrument-free pipet loading. Two designs of the SlipChip, two-step slipping and one-step slipping, were validated using digital RPA. By using the digital RPA SlipChip, false-positive results from preinitiation of the RPA amplification reaction before incubation were eliminated. End point fluorescence readout was used for "yes or no" digital quantification. The performance of digital RPA in a SlipChip was validated by amplifying and counting single molecules of the target nucleic acid, methicillin-resistant Staphylococcus aureus (MRSA) genomic DNA. The digital RPA on SlipChip was also tolerant to fluctuations of the incubation temperature (37-42 °C), and its performance was comparable to digital PCR on the same SlipChip design. The digital RPA SlipChip provides a simple method to quantify nucleic acids without requiring thermal cycling or kinetic measurements, with potential applications in diagnostics and environmental monitoring under resource-limited settings. The ability to initiate thousands of chemical reactions in parallel on the nanoliter scale using solvent-resistant glass devices is likely to be useful for a broader range of applications.
Figures
Similar articles
-
Digital PCR on a SlipChip.Lab Chip. 2010 Oct 21;10(20):2666-72. doi: 10.1039/c004521g. Epub 2010 Jul 1. Lab Chip. 2010. PMID: 20596567 Free PMC article.
-
Multiplex digital PCR with digital melting curve analysis on a self-partitioning SlipChip.Analyst. 2022 Feb 14;147(4):625-633. doi: 10.1039/d1an01916c. Analyst. 2022. PMID: 35107102
-
Experimental investigation of confinement effect in single molecule amplification via real-time digital PCR on a multivolume droplet array SlipChip.Anal Chim Acta. 2024 May 22;1304:342541. doi: 10.1016/j.aca.2024.342541. Epub 2024 Mar 28. Anal Chim Acta. 2024. PMID: 38637051
-
Digital Recombinase Polymerase Amplification, Digital Loop-Mediated Isothermal Amplification, and Digital CRISPR-Cas Assisted Assay: Current Status, Challenges, and Perspectives.Small. 2023 Dec;19(49):e2303398. doi: 10.1002/smll.202303398. Epub 2023 Aug 23. Small. 2023. PMID: 37612816 Review.
-
The future in diagnostic tools for TB outbreaks: A review of the approaches with focus on LAMP and RPA diagnostics tests.J Microbiol Methods. 2024 Dec;227:107064. doi: 10.1016/j.mimet.2024.107064. Epub 2024 Oct 22. J Microbiol Methods. 2024. PMID: 39448035 Review.
Cited by
-
Instrument for Real-Time Digital Nucleic Acid Amplification on Custom Microfluidic Devices.PLoS One. 2016 Oct 19;11(10):e0163060. doi: 10.1371/journal.pone.0163060. eCollection 2016. PLoS One. 2016. PMID: 27760148 Free PMC article.
-
Rapid genome detection of Schmallenberg virus and bovine viral diarrhea virus by use of isothermal amplification methods and high-speed real-time reverse transcriptase PCR.J Clin Microbiol. 2014 Jun;52(6):1883-92. doi: 10.1128/JCM.00167-14. Epub 2014 Mar 19. J Clin Microbiol. 2014. PMID: 24648561 Free PMC article.
-
Isothermal Recombinase Polymerase Amplification (RPA) of E. coli gDNA in Commercially Fabricated PCB-Based Microfluidic Platforms.Micromachines (Basel). 2021 Nov 12;12(11):1387. doi: 10.3390/mi12111387. Micromachines (Basel). 2021. PMID: 34832799 Free PMC article.
-
Nanomaterial-based optical and electrochemical techniques for detection of methicillin-resistant Staphylococcus aureus: a review.Mikrochim Acta. 2019 Jan 16;186(2):114. doi: 10.1007/s00604-018-3186-7. Mikrochim Acta. 2019. PMID: 30648216 Review.
-
Robust dipstick urinalysis using a low-cost, micro-volume slipping manifold and mobile phone platform.Lab Chip. 2016 May 24;16(11):2069-78. doi: 10.1039/c6lc00340k. Lab Chip. 2016. PMID: 27166097 Free PMC article.
References
Publication types
MeSH terms
Substances
Grants and funding
LinkOut - more resources
Full Text Sources
Other Literature Sources
