

Modeling subharmonic response from contrast microbubbles as a function of ambient static pressure
- PMID: 21476688
- PMCID: PMC3087400
- DOI: 10.1121/1.3552884
Modeling subharmonic response from contrast microbubbles as a function of ambient static pressure
Abstract
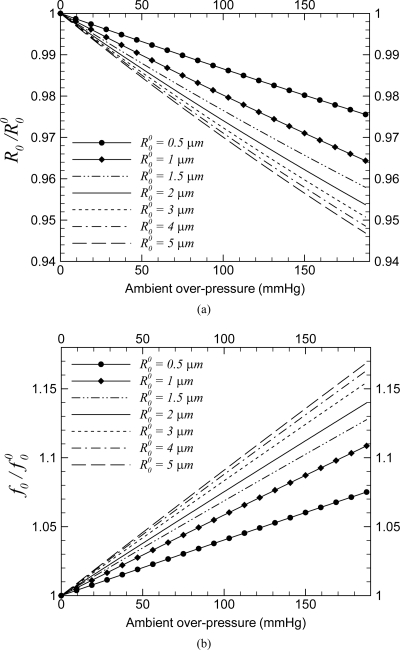
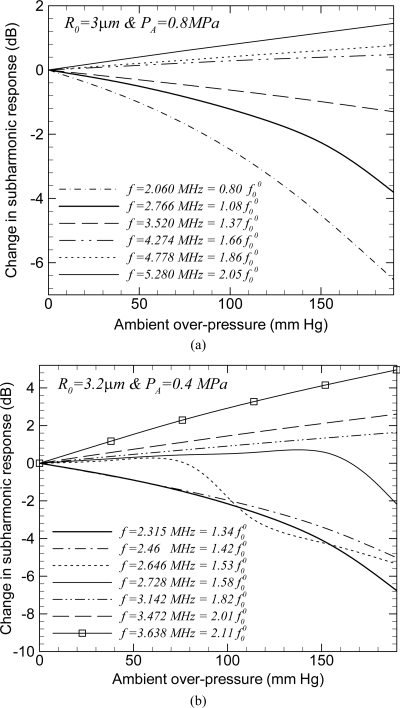
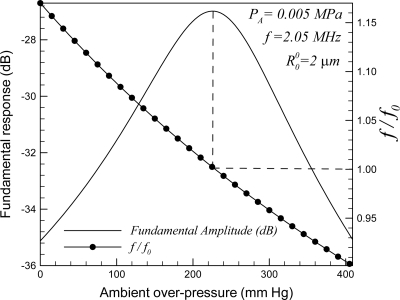
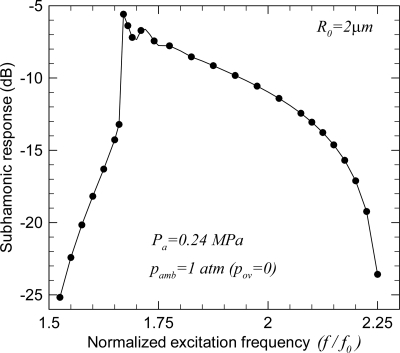
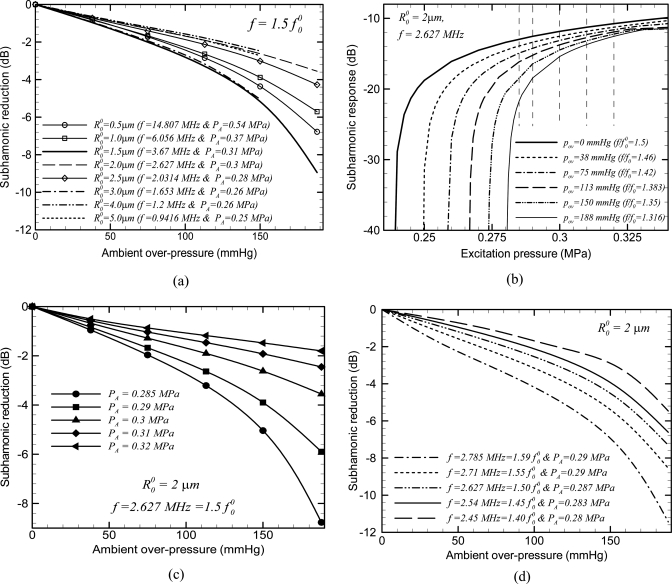
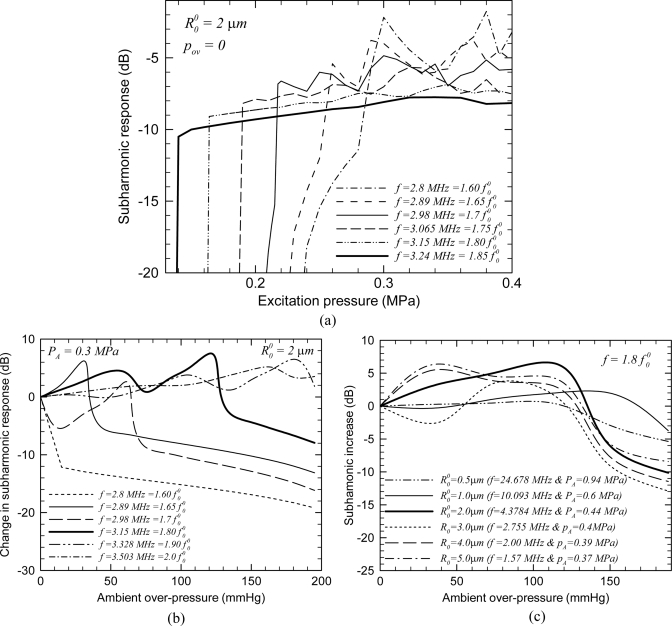
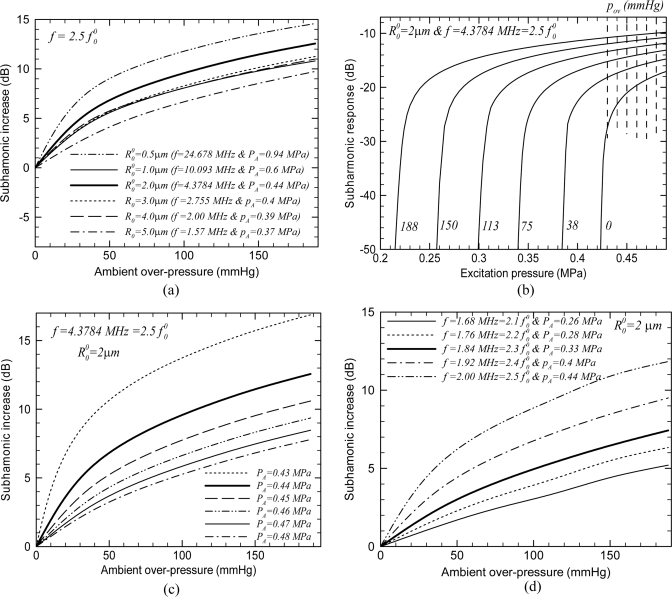
Variation of subharmonic response from contrast microbubbles with ambient pressure is numerically investigated for non-invasive monitoring of organ-level blood pressure. Previously, several contrast microbubbles both in vitro and in vivo registered approximately linear (5-15 dB) subharmonic response reduction with 188 mm Hg change in ambient pressure. In contrast, simulated subharmonic response from a single microbubble is seen here to either increase or decrease with ambient pressure. This is shown using the code BUBBLESIM for encapsulated microbubbles, and then the underlying dynamics is investigated using a free bubble model. The ratio of the excitation frequency to the natural frequency of the bubble is the determining parameter--increasing ambient pressure increases natural frequency thereby changing this ratio. For frequency ratio below a lower critical value, increasing ambient pressure monotonically decreases subharmonic response. Above an upper critical value of the same ratio, increasing ambient pressure increases subharmonic response; in between, the subharmonic variation is non-monotonic. The precise values of frequency ratio for these three different trends depend on bubble radius and excitation amplitude. The modeled increase or decrease of subharmonic with ambient pressure, when one happens, is approximately linear only for certain range of excitation levels. Possible reasons for discrepancies between model and previous experiments are discussed.
Figures
Similar articles
-
Ambient Pressure Sensitivity of the Subharmonic Response of Coated Microbubbles: Effects of Acoustic Excitation Parameters.Ultrasound Med Biol. 2023 Jul;49(7):1550-1560. doi: 10.1016/j.ultrasmedbio.2023.02.019. Epub 2023 Apr 25. Ultrasound Med Biol. 2023. PMID: 37100673 Free PMC article.
-
Ambient Pressure Sensitivity of Subharmonic Vibrating Single Microbubbles.Ultrasound Med Biol. 2025 Jun;51(6):931-940. doi: 10.1016/j.ultrasmedbio.2025.01.016. Epub 2025 Mar 4. Ultrasound Med Biol. 2025. PMID: 40044553
-
[Experimental study on high-frequency subharmonic scattering characteristics of ultrasound contrast agent microbubbles under low ambient pressure].Sheng Wu Yi Xue Gong Cheng Xue Za Zhi. 2023 Dec 25;40(6):1209-1216. doi: 10.7507/1001-5515.202304012. Sheng Wu Yi Xue Gong Cheng Xue Za Zhi. 2023. PMID: 38151945 Free PMC article. Chinese.
-
Dynamic manipulation of the subharmonic scattering of phospholipid-coated microbubbles.Phys Med Biol. 2011 Oct 7;56(19):6459-73. doi: 10.1088/0031-9155/56/19/018. Epub 2011 Sep 20. Phys Med Biol. 2011. PMID: 21934190
-
A Review of Phospholipid Encapsulated Ultrasound Contrast Agent Microbubble Physics.Ultrasound Med Biol. 2019 Feb;45(2):282-300. doi: 10.1016/j.ultrasmedbio.2018.09.020. Epub 2018 Nov 7. Ultrasound Med Biol. 2019. PMID: 30413335 Review.
Cited by
-
On Factors Affecting Subharmonic-aided Pressure Estimation (SHAPE).Ultrason Imaging. 2019 Jan;41(1):35-48. doi: 10.1177/0161734618812083. Epub 2018 Nov 12. Ultrason Imaging. 2019. PMID: 30417745 Free PMC article.
-
Subharmonic contrast microbubble signals for noninvasive pressure estimation under static and dynamic flow conditions.Ultrason Imaging. 2011 Jul;33(3):153-64. doi: 10.1177/016173461103300301. Ultrason Imaging. 2011. PMID: 21842580 Free PMC article.
-
Echogenic Exosomes as ultrasound contrast agents.Nanoscale Adv. 2020 Aug 1;2(8):3411-3422. doi: 10.1039/d0na00339e. Epub 2020 Jun 18. Nanoscale Adv. 2020. PMID: 36034734 Free PMC article.
-
On the implementation of an automated acoustic output optimization algorithm for subharmonic aided pressure estimation.Ultrasonics. 2013 Apr;53(4):880-8. doi: 10.1016/j.ultras.2012.12.010. Epub 2013 Jan 2. Ultrasonics. 2013. PMID: 23347593 Free PMC article.
-
Subharmonic microbubble emissions for noninvasively tracking right ventricular pressures.Am J Physiol Heart Circ Physiol. 2012 Jul;303(1):H126-32. doi: 10.1152/ajpheart.00560.2011. Epub 2012 May 4. Am J Physiol Heart Circ Physiol. 2012. PMID: 22561300 Free PMC article.
References
-
- Goldberg B. B., Raichlen J. S., and Forsberg F., Ultrasound Contrast Agents: Basic Principles and Clinical Applications, 2nd ed. (Martin Dunitz, London, 2001), pp. 1–440.
-
- de Jong N., Cornet R., and Lancee C. T., “Higher harmonics of vibrating gas-filled microspheres two measurements,” Ultrasonics 32, 455–459 (1994).10.1016/0041-624X(94)90065-5 - DOI
Publication types
MeSH terms
Grants and funding
LinkOut - more resources
Full Text Sources
Miscellaneous