. 2011 Apr 7;134(13):134108.
doi: 10.1063/1.3574397.

Toward canonical ensemble distribution from self-guided Langevin dynamics simulation

Affiliations

Toward canonical ensemble distribution from self-guided Langevin dynamics simulation

Xiongwu Wu et al. J Chem Phys. .

Abstract

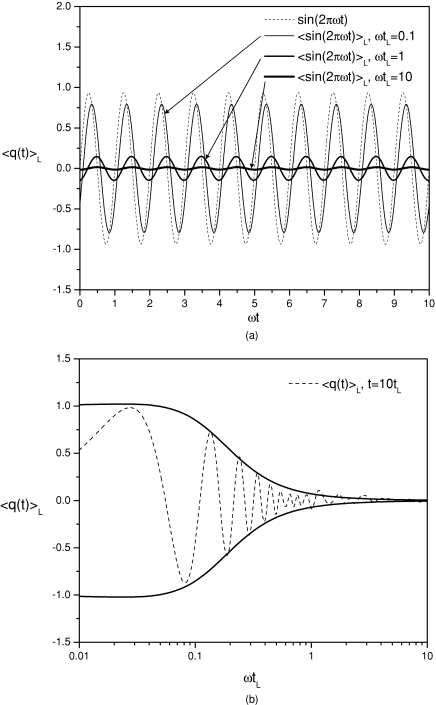
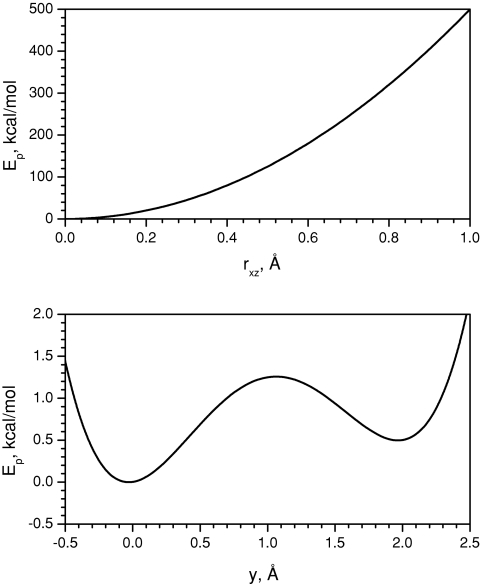
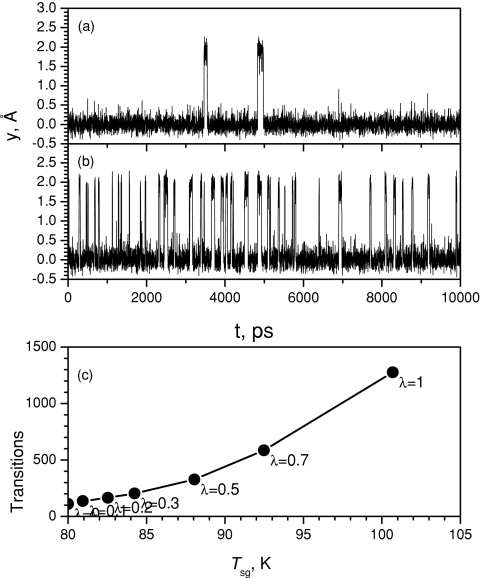
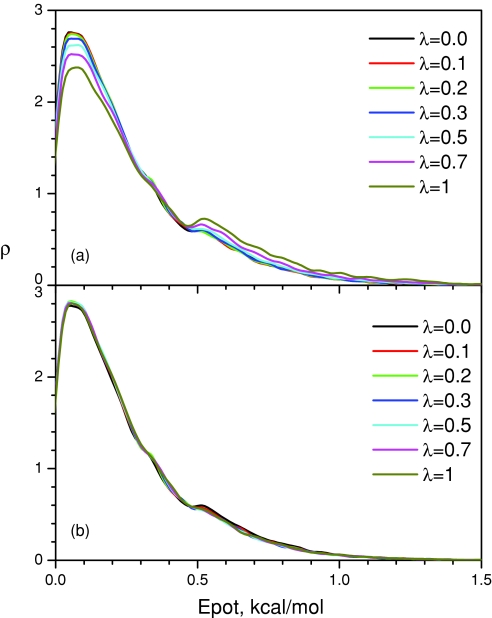
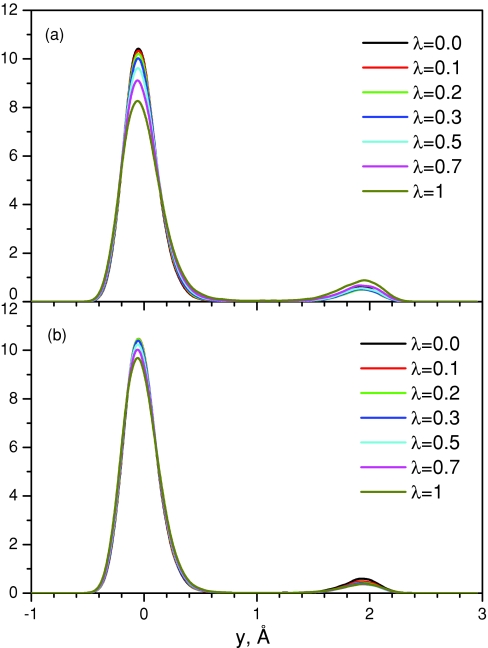
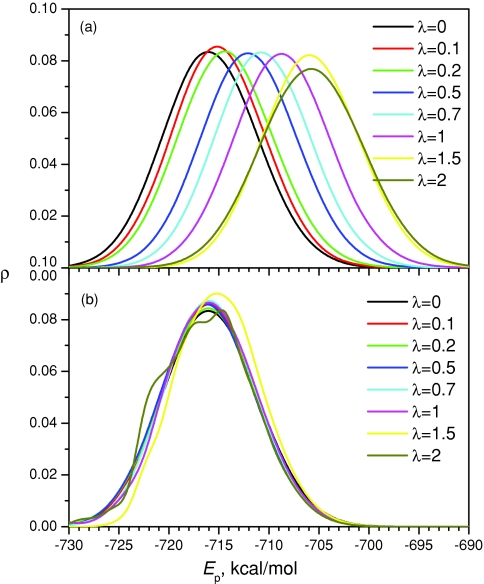
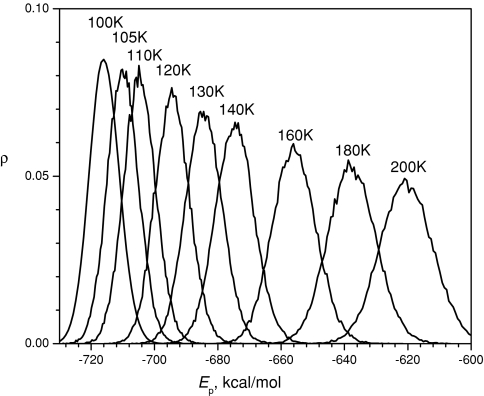
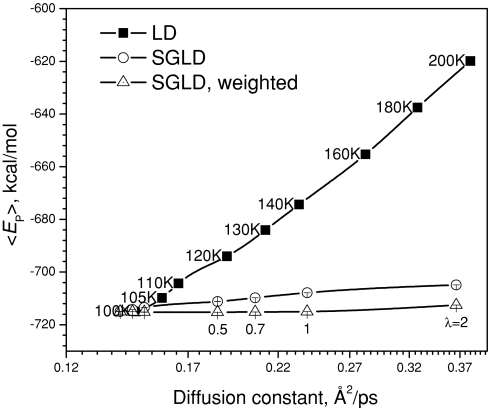
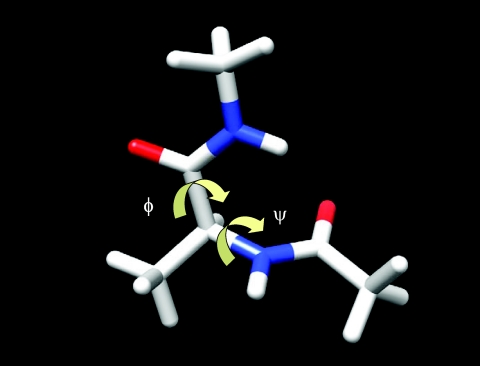
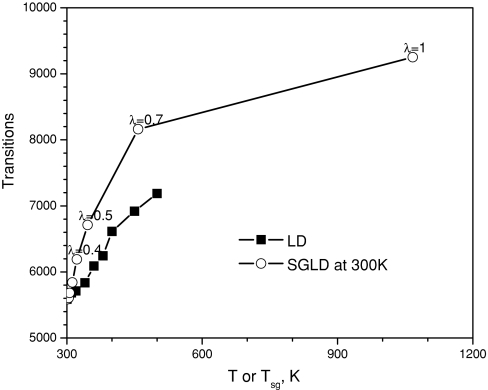
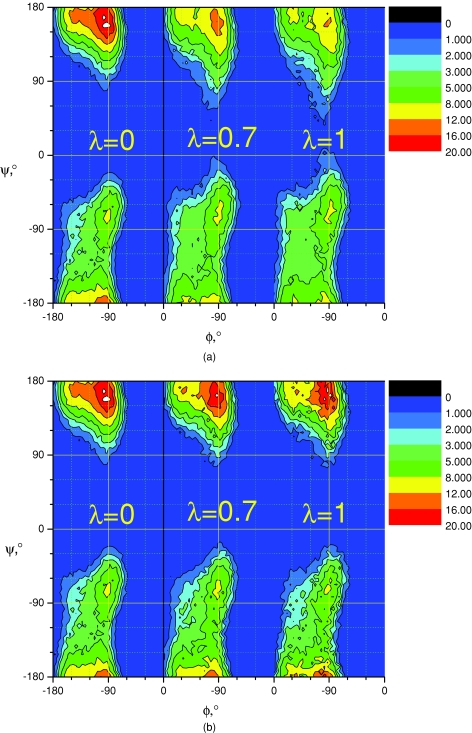
This work derives a quantitative description of the conformational distribution in self-guided Langevin dynamics (SGLD) simulations. SGLD simulations employ guiding forces calculated from local average momentums to enhance low-frequency motion. This enhancement in low-frequency motion dramatically accelerates conformational search efficiency, but also induces certain perturbations in conformational distribution. Through the local averaging, we separate properties of molecular systems into low-frequency and high-frequency portions. The guiding force effect on the conformational distribution is quantitatively described using these low-frequency and high-frequency properties. This quantitative relation provides a way to convert between a canonical ensemble and a self-guided ensemble. Using example systems, we demonstrated how to utilize the relation to obtain canonical ensemble properties and conformational distributions from SGLD simulations. This development makes SGLD not only an efficient approach for conformational searching, but also an accurate means for conformational sampling.


Figures

Figure 1
Figure 1
(a) The example function, q(t) = sin (2πϖt), and its evolving averages at three local average times: ϖtL = 0.1, 1, and 10. (b) The evolving average of the example function as a function of the frequency. The envelope curves show the amplitude as a function of ϖtL. At small ϖtL, which corresponds to a low frequency, the amplitude is approaching 1, very similar to that of the example function, while at a large ϖtL, which corresponds to a high frequency, the amplitude approaches 0.
Figure 2
Figure 2
The skewed double well potential along the y-axis (lower panel) when rxz = 0 and perpendicular to the y-axis (upper panel) when y = 0.
Figure 3
Figure 3
Transitions of the particle in the double well system. (a) Trajectory in the LD simulation; (b) Trajectory in the SGLD simulation with λ = 1 where Tsg = 100.7 K. (c) Transition number as a function of the self-guiding temperature, Tsg. The collision frequency is 10∕ps and temperature is 80 K.
Figure 4
Figure 4
The energy distributions of the double well system in the SGLD simulations: (a) unweighted; (b) weighted. The collision frequency is 10∕ps and temperature is 80 K.
Figure 5
Figure 5
The y-coordinate distributions of the double well system in the SGLD simulations: (a) unweighted; (b) weighted. The collision frequency is 10∕ps and temperature is 80 K.
Figure 6
Figure 6
The energy distributions of the argon liquid in the SGLD simulations at 100 K: (a) unweighted; (b) weighted. The collision frequency is 1∕ps.
Figure 7
Figure 7
The energy distributions of the argon liquid in the LD simulations at different temperatures (as labeled). The collision frequency is 1∕ps.
Figure 8
Figure 8
Average potential energies vs diffusion constants for the argon liquid in the LD simulations at different temperatures (as labeled) and in the SGLD simulations at different guiding factors (as labeled). The collision frequency is 1∕ps. The SGLD simulations were performed at 100 K.
Figure 9
Figure 9
A conformation of an alanine dipeptide. Chemical bonds are shown as sticks. Oxygen and nitrogen atoms are shown as red and blue, respectively. Two backbone dihedral angles, ϕ and ψ, are marked by arrows.
Figure 10
Figure 10
Conformational transitions of the alanine dipeptide as a function of temperature in the LD simulations and as a function of the self-guiding temperature, Tsg, in the SGLD simulations. The self-guiding temperature, Tsg, defined by Eq. 27, reflects the conformational searching ability that is comparable to a high-temperature simulation at T = Tsg. The collision frequency is γ = 10∕ps. The SGLD simulations were performed at 300 K.
Figure 11
Figure 11
(a) ϕ−ψ distributions of the alanine dipeptide in the LD (λ = 0) and SGLD simulations at λ = 0.7 and λ = 1 before reweighting. The collision frequency is γ = 10∕ps. The SGLD simulations were performed at 300 K. (b) ϕ−ψ distributions of the alanine dipeptide in the LD (λ = 0) and SGLD simulations at λ = 0.7 and λ = 1 after reweighting. The collision frequency is γ = 10∕ps. The SGLD simulations were performed at 300 K.

References

    1. Wu X. and Brooks B. R., Chem. Phys. Lett. 381(3–4), 512 (2003). 10.1016/j.cplett.2003.10.013 - DOI
    1. Damjanović A., García-Moreno E. B., and Brooks B. R., Proteins: Struct., Funct., Bioinf. 76(4), 1007 (2009); - PMC - PubMed
    2. Damjanović A., Miller B. T., Wenaus T. J., Maksimović P., Bertrand García-Moreno E., and Brooks B. R., J. Chem. Inf. Model. 48(10), 2021 (2008); - PubMed
    3. Lee M. S. and Olson M. A., J. Chem. Theory Comput. 6(8), 2477 (2010); 10.1021/ct100062b - DOI - PubMed
    4. Lee C. I. and Chang N. Y., Biophys. Chem. 151(1–2), 86 (2010). 10.1016/j.bpc.2010.05.002 - DOI - PubMed
    1. Damjanović A., Wu X., García-Moreno E. B., and Brooks B. R., Biophys. J. 95(9), 4091 (2008). - PMC - PubMed
    1. Andricioaei I., Dinner A. R., and Karplus M., J. Chem. Phys. 118(3), 1074 (2003). 10.1063/1.1528893 - DOI
    1. Wu X. and Wang S., J. Chem. Phys. 110(19), 9401 (1999); 10.1063/1.478948 - DOI
    2. Wu X. and Wang S., J. Phys. Chem. B 102(37), 7238 (1998); 10.1021/jp9817372 - DOI
    3. Wu X.-W. and Sung S.-S., Proteins: Struct. Funct. Genet. 34(3), 295 (1999). - PubMed