

Effects of intima stiffness and plaque morphology on peak cap stress
- PMID: 21477277
- PMCID: PMC3090737
- DOI: 10.1186/1475-925X-10-25
Effects of intima stiffness and plaque morphology on peak cap stress
Abstract
Background: Rupture of the cap of a vulnerable plaque present in a coronary vessel may cause myocardial infarction and death. Cap rupture occurs when the peak cap stress exceeds the cap strength. The mechanical stress within a cap depends on the plaque morphology and the material characteristics of the plaque components. A parametric study was conducted to assess the effect of intima stiffness and plaque morphology on peak cap stress.
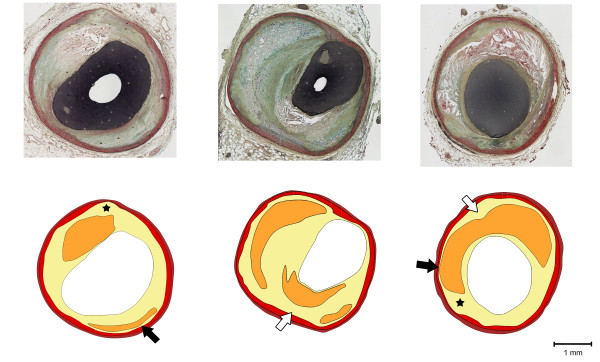
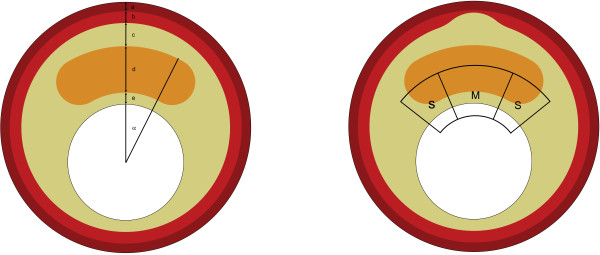
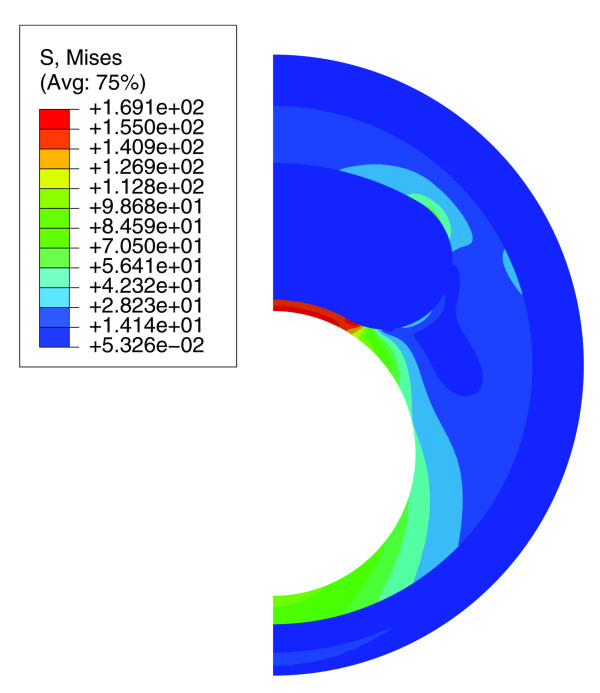
Methods: Models with idealized geometries based on histology images of human coronary arteries were generated by varying geometric plaque features. The constructed multi-layer models contained adventitia, media, intima, and necrotic core sections. For adventitia and media layers, anisotropic hyperelastic material models were used. For necrotic core and intima sections, isotropic hyperelastic material models were employed. Three different intima stiffness values were used to cover the wide range reported in literature. According to the intima stiffness, the models were classified as stiff, intermediate and soft intima models. Finite element method was used to compute peak cap stress.
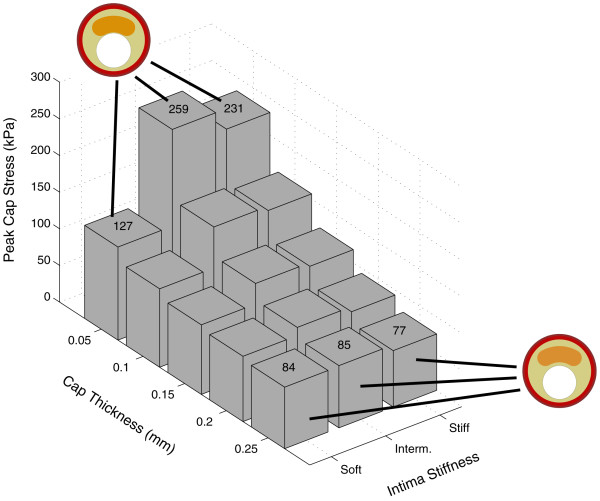
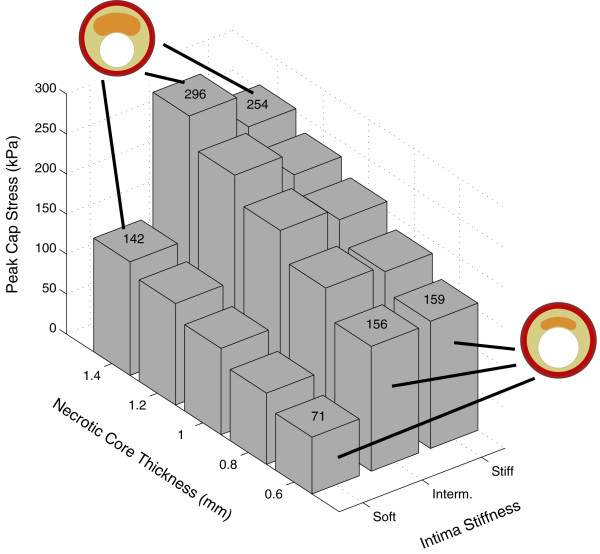
Results: The intima stiffness was an essential determinant of cap stresses. The computed peak cap stresses for the soft intima models were much lower than for stiff and intermediate intima models. Intima stiffness also affected the influence of morphological parameters on cap stresses. For the stiff and intermediate intima models, the cap thickness and necrotic core thickness were the most important determinants of cap stresses. The peak cap stress increased three-fold when the cap thickness was reduced from 0.25 mm to 0.05 mm for both stiff and intermediate intima models. Doubling the thickness of the necrotic core elevated the peak cap stress by 60% for the stiff intima models and by 90% for the intermediate intima models. Two-fold increase in the intima thickness behind the necrotic core reduced the peak cap stress by approximately 25% for both intima models. For the soft intima models, cap thickness was less critical and changed the peak cap stress by 55%. However, the necrotic core thickness was more influential and changed the peak cap stress by 100%. The necrotic core angle emerged as a critical determinant of cap stresses where a larger angle lowered the cap stresses. Contrary to the stiff and intermediate intima models, a thicker intima behind the necrotic core increased the peak cap stress by approximately 25% for the soft intima models. Adventitia thickness and local media regression had limited effects for all three intima models.
Conclusions: For the stiff and intermediate intima models, the cap thickness was the most important morphological risk factor. However for soft intima models, the necrotic core thickness and necrotic core angle had a bigger impact on the peak cap stress. We therefore need to enhance our knowledge of intima material properties if we want to derive critical morphological plaque features for risk evaluation.
Figures
Similar articles
-
The effects of plaque morphology and material properties on peak cap stress in human coronary arteries.Comput Methods Biomech Biomed Engin. 2016;19(7):771-9. doi: 10.1080/10255842.2015.1062091. Epub 2015 Aug 3. Comput Methods Biomech Biomed Engin. 2016. PMID: 26237279
-
Effect of residual stress on peak cap stress in arteries.Math Biosci Eng. 2014 Oct;11(5):1199-214. doi: 10.3934/mbe.2014.11.1199. Math Biosci Eng. 2014. PMID: 25347810
-
Stratification of risk in thin cap fibroatheromas using peak plaque stress estimates from idealized finite element models.Med Eng Phys. 2012 Nov;34(9):1330-8. doi: 10.1016/j.medengphy.2011.12.024. Epub 2012 Feb 17. Med Eng Phys. 2012. PMID: 22342558
-
Local elasticity imaging of vulnerable atherosclerotic coronary plaques.Adv Cardiol. 2007;44:35-61. doi: 10.1159/000096719. Adv Cardiol. 2007. PMID: 17075198 Review.
-
Coronary atherosclerosis: determinants of plaque rupture.Eur Heart J. 1998 Apr;19 Suppl C:C24-9. Eur Heart J. 1998. PMID: 9597422 Review.
Cited by
-
3D patient-specific modeling and structural finite element analysis of atherosclerotic carotid artery based on computed tomography angiography.Sci Rep. 2023 Nov 14;13(1):19911. doi: 10.1038/s41598-023-46949-5. Sci Rep. 2023. PMID: 37964071 Free PMC article.
-
Fusion of fibrous cap thickness and wall shear stress to assess plaque vulnerability in coronary arteries: a pilot study.Int J Comput Assist Radiol Surg. 2016 Oct;11(10):1779-90. doi: 10.1007/s11548-016-1422-3. Epub 2016 May 28. Int J Comput Assist Radiol Surg. 2016. PMID: 27236652 Free PMC article.
-
Numerical simulation study on opening blood-brain barrier by ultrasonic cavitation.Ultrason Sonochem. 2024 Oct;109:107005. doi: 10.1016/j.ultsonch.2024.107005. Epub 2024 Jul 30. Ultrason Sonochem. 2024. PMID: 39098097 Free PMC article.
-
Noninvasive assessment of carotid plaque with subharmonic aided pressure estimation from a US contrast agent: A preliminary study.Clin Transl Sci. 2023 Mar;16(3):502-511. doi: 10.1111/cts.13465. Epub 2023 Jan 5. Clin Transl Sci. 2023. PMID: 36606307 Free PMC article.
-
A Framework for Local Mechanical Characterization of Atherosclerotic Plaques: Combination of Ultrasound Displacement Imaging and Inverse Finite Element Analysis.Ann Biomed Eng. 2016 Apr;44(4):968-79. doi: 10.1007/s10439-015-1410-8. Epub 2015 Sep 23. Ann Biomed Eng. 2016. PMID: 26399991 Free PMC article.
References
-
- Schaar JA, Muller JE, Falk E, Virmani R, Fuster V, Serruys PW, Colombo A, Stefanadis C, Ward Casscells S, Moreno PR. et al.Terminology for high-risk and vulnerable coronary artery plaques. Report of a meeting on the vulnerable plaque, June 17 and 18, 2003, Santorini, Greece. Eur Heart J. 2004;25:1077–1082. doi: 10.1016/j.ehj.2004.01.002. - DOI - PubMed
-
- Falk E, Shah PK, Fuster V. Coronary plaque disruption. Circulation. 1995;92:657–671. - PubMed
-
- Naghavi M, Libby P, Falk E, Casscells SW, Litovsky S, Rumberger J, Badimon JJ, Stefanadis C, Moreno P, Pasterkamp G. et al.From vulnerable plaque to vulnerable patient: a call for new definitions and risk assessment strategies: Part I. Circulation. 2003;108:1664–1672. doi: 10.1161/01.CIR.0000087480.94275.97. - DOI - PubMed
-
- Tang D, Teng Z, Canton G, Hatsukami TS, Dong L, Huang X, Yuan C. Local critical stress correlates better than global maximum stress with plaque morphological features linked to atherosclerotic plaque vulnerability: an in vivo multi-patient study. Biomed Eng Online. 2009;8:15. doi: 10.1186/1475-925X-8-15. - DOI - PMC - PubMed
-
- Tang D, Teng Z, Canton G, Yang C, Ferguson M, Huang X, Zheng J, Woodard PK, Yuan C. Sites of rupture in human atherosclerotic carotid plaques are associated with high structural stresses: an in vivo MRI-based 3D fluid-structure interaction study. Stroke. 2009;40:3258–3263. doi: 10.1161/STROKEAHA.109.558676. - DOI - PMC - PubMed
Publication types
MeSH terms
LinkOut - more resources
Full Text Sources
Miscellaneous
