. 2011 Apr 10:9:14.
doi: 10.1186/1477-3155-9-14.

Quantitative analysis of nanoparticle internalization in mammalian cells by high resolution X-ray microscopy

Affiliations

Quantitative analysis of nanoparticle internalization in mammalian cells by high resolution X-ray microscopy

Hsiang-Hsin Chen et al. J Nanobiotechnology. .

Abstract

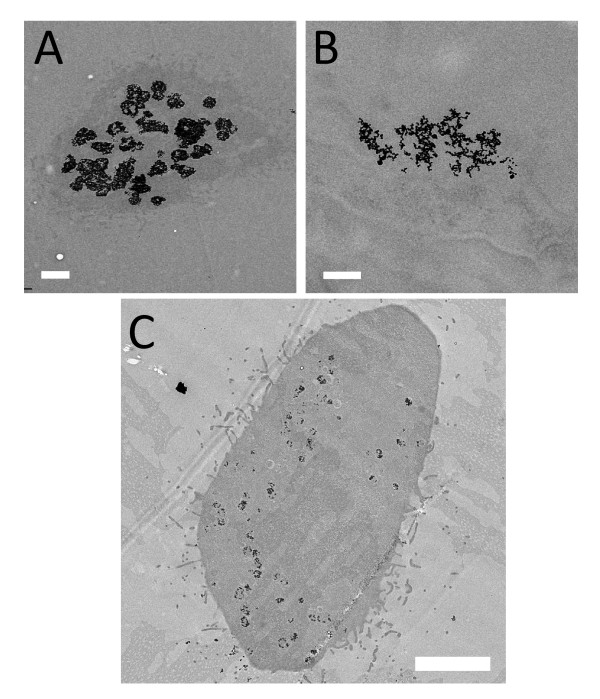
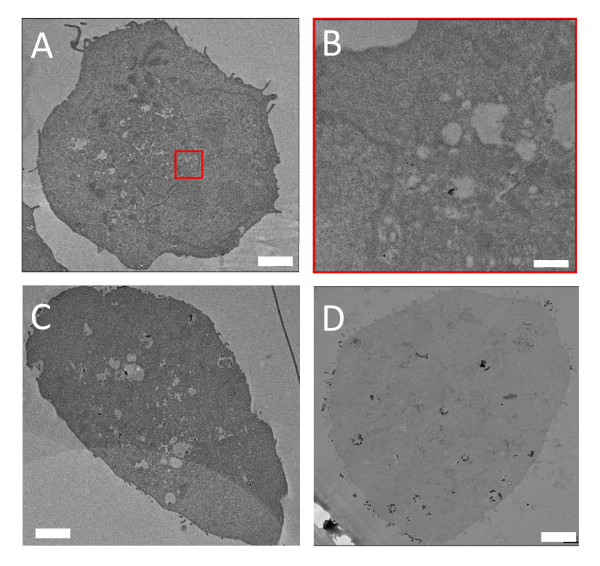
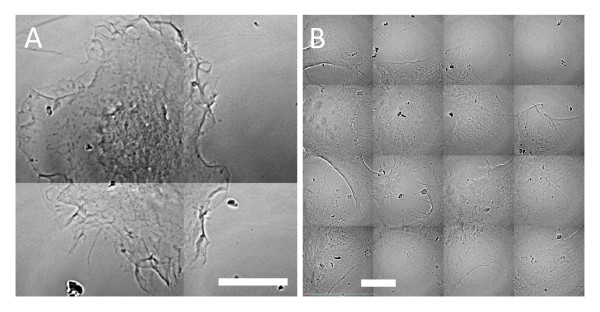
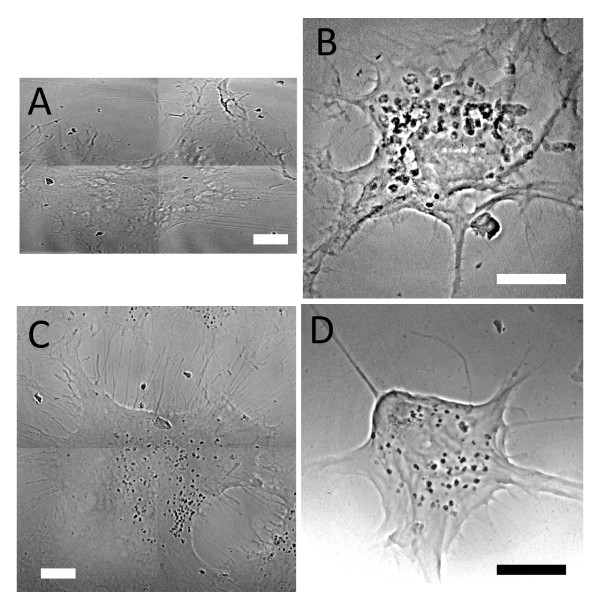
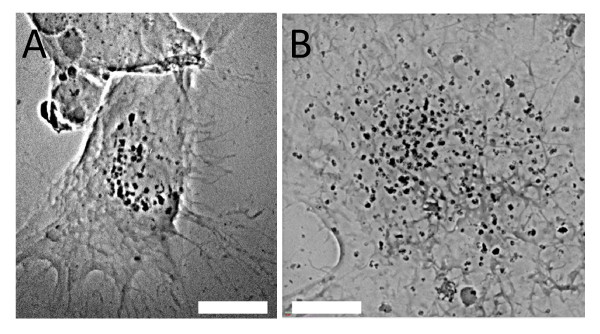
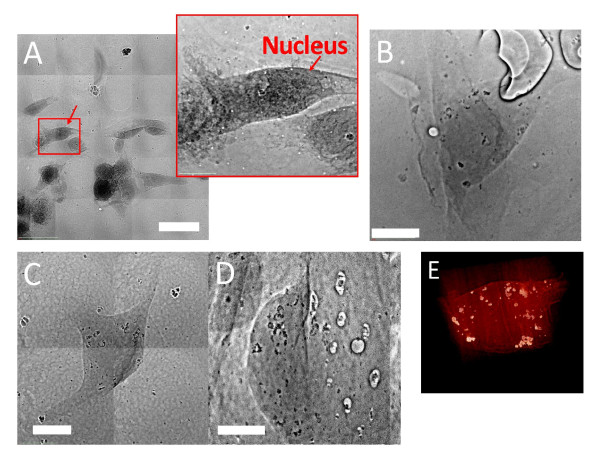
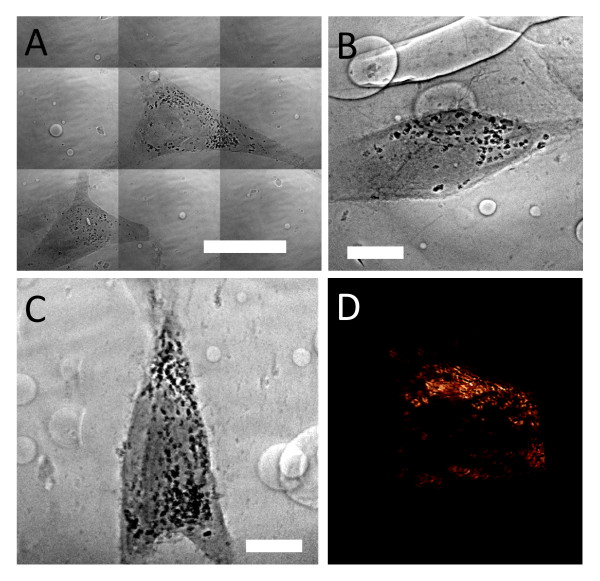
Background: Quantitative analysis of nanoparticle uptake at the cellular level is critical to nanomedicine procedures. In particular, it is required for a realistic evaluation of their effects. Unfortunately, quantitative measurements of nanoparticle uptake still pose a formidable technical challenge. We present here a method to tackle this problem and analyze the number of metal nanoparticles present in different types of cells. The method relies on high-lateral-resolution (better than 30 nm) transmission x-ray microimages with both absorption contrast and phase contrast -- including two-dimensional (2D) projection images and three-dimensional (3D) tomographic reconstructions that directly show the nanoparticles.

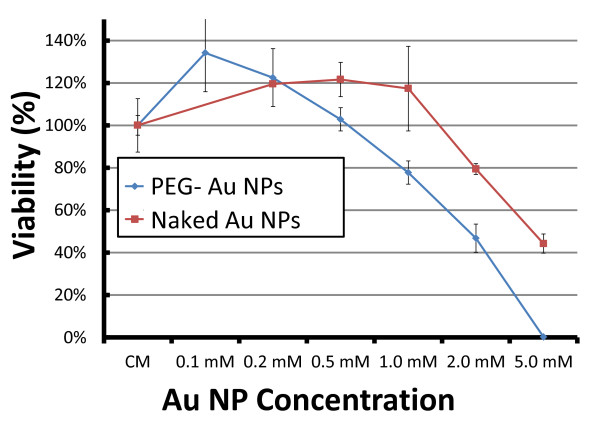
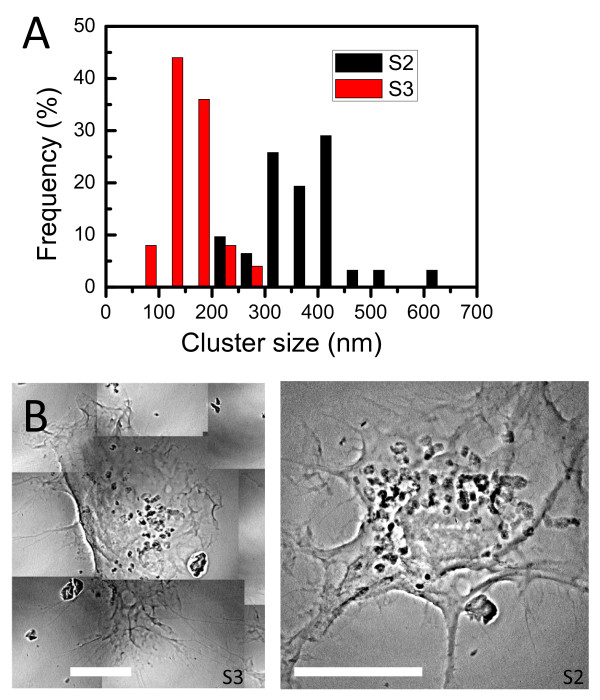
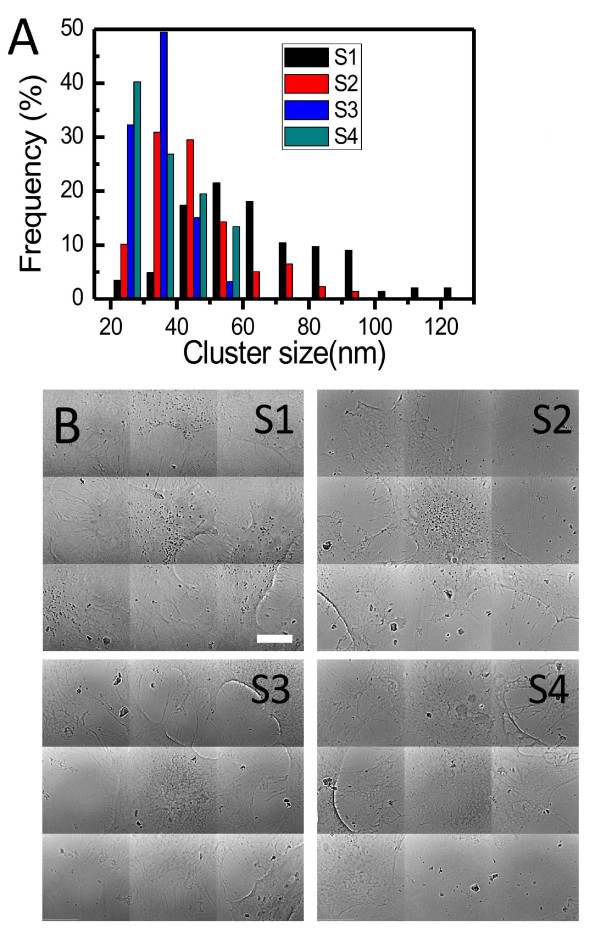
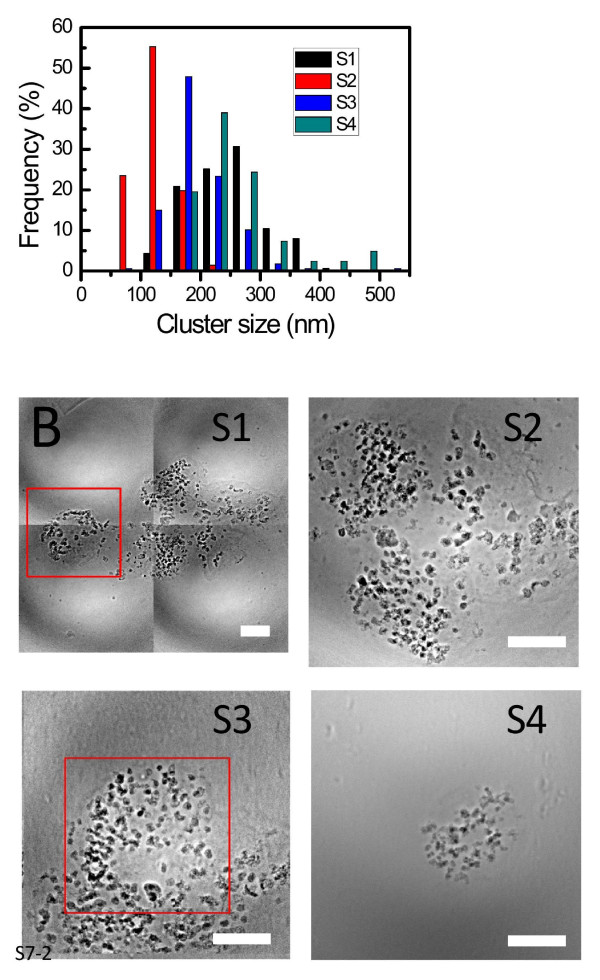
Results: Practical tests were successfully conducted on bare and polyethylene glycol (PEG) coated gold nanoparticles obtained by x-ray irradiation. Using two different cell lines, EMT and HeLa, we obtained the number of nanoparticle clusters uptaken by each cell and the cluster size. Furthermore, the analysis revealed interesting differences between 2D and 3D cultured cells as well as between 2D and 3D data for the same 3D specimen.

Conclusions: We demonstrated the feasibility and effectiveness of our method, proving that it is accurate enough to measure the nanoparticle uptake differences between cells as well as the sizes of the formed nanoparticle clusters. The differences between 2D and 3D cultures and 2D and 3D images stress the importance of the 3D analysis which is made possible by our approach.


Figures

Figure 1
Figure 1
Results of the cell survival test. Cell survival test of EMT cells exposed to AuNPs with or without PEG capping. The cells were continuously co-cultured with colloidal nanoparticles for 24 h. The cell viability was measured by direct counting the cell number by trypan blue exclusion. The data are plotted as the percentage of surviving cells compared to untreated control specimens.
Figure 2
Figure 2
Results of the flow cytometry. The flow cytometry profile of the EMT cell cycle after co-culturing with PEG-coated AuNPs with different colloidal concentrations was performed with a fluorescence-activated cell sorter (FACS). There was no significant increase in the apoptotic cells as the nanoparticle concentration increased (A: Control, B: 0.1 mM, C: 0.5 mM, D: 1.0 mM), indicating that the apoptosis is not likely to cause the observed cell damage in this case.
Figure 3
Figure 3
TEM images of cells with internalized AuNPs. After co-culturing with 500 μM colloidal naked AuNPs for 48 h, the endocytotic vesicles of these cells were found to contain clusters of many AuNPs inside the cytoplasm. Note that the size of the clusters is significantly larger for EMT cells (A and B) than for HeLa cells (C). Bars: 1 μm (A), 200 nm (B) and 5 μm (C).
Figure 4
Figure 4
TEM images of EMT cells for different naked AuNP co-culture times. A) co-culturing with 500 μM AuNP colloid for 30 min: only a few AuNPs can be found on the surface or inside the cytoplasm. The red square (B) marks the area where clusters are found. C) 1 h co-culture time: a larger number of endocytotic vesicles containing AuNPs is found in the cytoplasm. D) 6 h co-culture time: the number and the size of endocytotic vesicles containing AuNPs are even larger. Bar: 2 μm (A, C and D) and 200 nm (B).
Figure 5
Figure 5
Transmission x-ray microscopy image of EMT and HeLa cells without chemical staining. A) EMT cell: some filopodia on the cell boundary are visible. B) HeLa cell: the membrane ruffles and the nuclei are clear. Bars: 10 μm).
Figure 6
Figure 6
Transmission x-ray microimages images showing the different internalization of AuNPs by different cell lines. A) An EMT cell co-cultured with 1 mM PEGcoated AuNPs for 48 h. B) An EMT cell co-cultured with 500 μM naked AuNPs for 48 h. C) A HeLa cell co-cultured with 500 μM naked AuNPs for 48 h. D) A CT-26 cell co-cultured with 500 μM naked AuNPs for 48 h. (Bars: 5 μm).
Figure 7
Figure 7
Transmission X-ray microimages of a 2D cultured HeLa cell. A) Co-cultured with500 μM naked AuNPs for 48h show the aggregation of AuNP clusters around the cell nucleus (Additional file 1). B) With NAB-Ni staining, AuNP clusters are imaged within the cell skeletons. Bars: 5 μm.
Figure 8
Figure 8
Transmission x-ray microimages of 3D cultured EMT cells. EMT cells were grown on an OPLA scaffold. A) Cells from an untreated (without nanoparticles) specimen stained with uranium acetate. The nuclei (one of them marked by an arrow) are clearly visible. Bar: 20 μm. B) EMT cells co-cultured with 500 μM naked AuNPs for 6h. The nucleus would not be visible without staining whereas the AuNPs could be observed for unstained specimens due to their strong contrast. Bar: 5 μm. (C) Patchwork of projection micrograph for an EMT cell co-cultured with 500 μM naked AuNPs. Bar: 5 μm. (D) Single projection images like this were collected for tomographic reconstruction at 1 degree intervals with respect to the incoming x-rays (Additional file 2). Bar: 5 μm. The cell was stained with uranium acetate, targeting the lipid membrane. E) Picture of the 3D tomographic reconstruction of an EMT cell. The nanoparticle cluster distribution can be reliably extracted from the corresponding movie (Additional file 3).
Figure 9
Figure 9
Transmission x-ray microimages of 3D cultured HeLa cells. Similar to Figure 7, the HeLa cells were grown on an OPLA scaffold. Bar in A: 20 μm, B and C: 5 μm. (Additional files 4 (9A) and 5 (9B))
Figure 10
Figure 10
EMT cells prepared as the pellets. EMT cell co-cultured with 500 μM naked AuNPs and prepared as the pellets; the specimen was not stained. A) Transmission x-ray projection micrograph (Additional file 6). Bar: 5 μm. B) 3D reconstructed tomography image (Additional file 7). Bar: 5 μm. The distribution of AuNPs is shown in the corresponding movie.
Figure 11
Figure 11
Quantitative analysis of the uptake of EMT cells by transmission x-ray microimages. Transmission x-ray uptake microanalysis by EMT cells after co-culturing with 500 μM naked AuNPs for 48 h. The size distribution in A) was obtained by analyzing individual cells such as that in B). Bars in B: 10 μm.
Figure 12
Figure 12
Quantitative analysis of the uptake of HeLa cells by transmission x-ray microimages. Results similar to those of Figure 10, for HeLa cells. Bar: 5 μm.
Figure 13
Figure 13
Quantitative uptake analysis of EMT plellets by 3D images. A) Internalized cluster size distribution from four x-ray transmission micrographs (B) of 3Dal pellet specimens of EMT cells. Bars: 5 μm. (Additional file 8).

References

    1. Kirchner C, Liedl T, Kudera S, Pellegrino T, Muñoz Javier A, Gaub HE, Stölzle S, Fertig N, Parak WJ. Cytotoxicity of colloidal CdSe and CdSe/ZnS nanoparticles. Nano Lett. 2005;9:331–338. doi: 10.1021/nl047996m. - DOI - PubMed
    1. Lin W, Huang YW, Zhou XD, Ma Y. In vitro toxicity of silica nanoparticles in human lung cancer cells. Toxicol Appl Pharmacol. 2006;9:252–259. doi: 10.1016/j.taap.2006.10.004. - DOI - PubMed
    1. Osman IF, Baumgartner A, Cemeli E, Fletcher JN, Anderson D. Genotoxicity and cytotoxicity of zinc oxide and titanium dioxide in HEp-2 cells. Nanomedicine (Lond) 2010;9:1193–1203. doi: 10.2217/nnm.10.52. - DOI - PubMed
    1. Tarantola M, Pietuch A, Schneider D, Rother J, Sunnick E, Rosman C, Pierrat S, Sonnichsen C, Wegener J, Janshoff A. Toxicity of gold-nanoparticles: Synergistic effects of shape and surface functionalization on micromotility of epithelial cells. Nanotoxicology. 2010. - PubMed
    1. Hainfeld JF, Slatkin DN, Smilowitz HM. The use of gold nanoparticles to enhance radiotherapy in mice. Phys Med Biol. 2004;9:N309–315. doi: 10.1088/0031-9155/49/18/N03. - DOI - PubMed

Publication types

MeSH terms

LinkOut - more resources