. 2011 Jun 3;286(22):19982-92.
doi: 10.1074/jbc.M111.240077. Epub 2011 Apr 8.

Identification of staphylococcal nuclease domain-containing 1 (SND1) as a Metadherin-interacting protein with metastasis-promoting functions

Affiliations

Identification of staphylococcal nuclease domain-containing 1 (SND1) as a Metadherin-interacting protein with metastasis-promoting functions

Mario Andres Blanco et al. J Biol Chem. .

Abstract

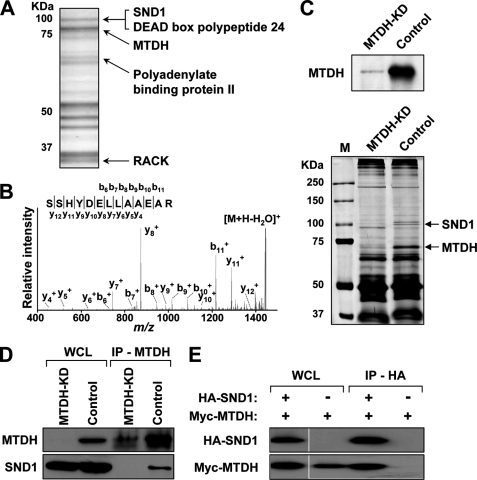
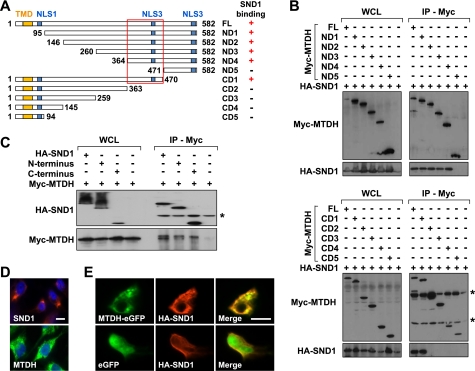
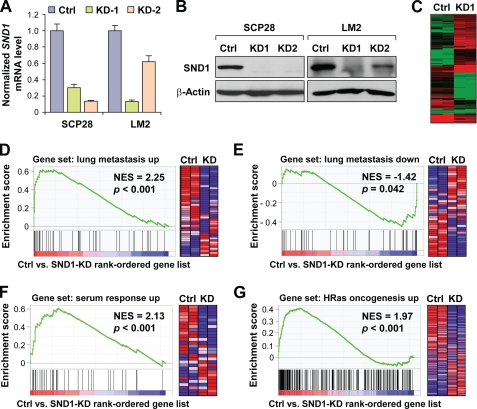
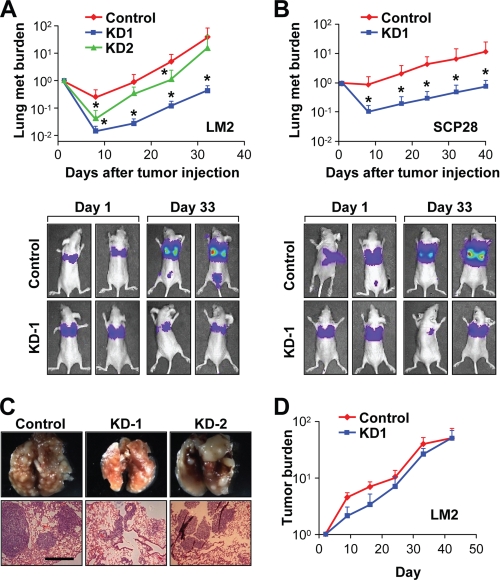
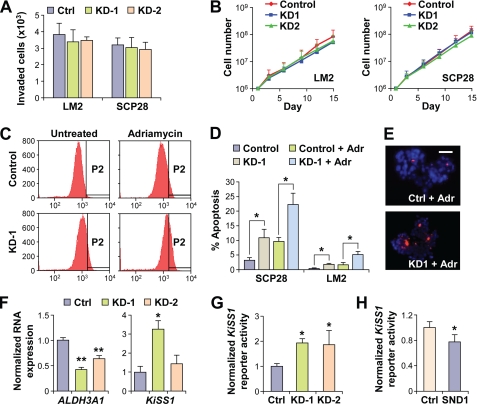
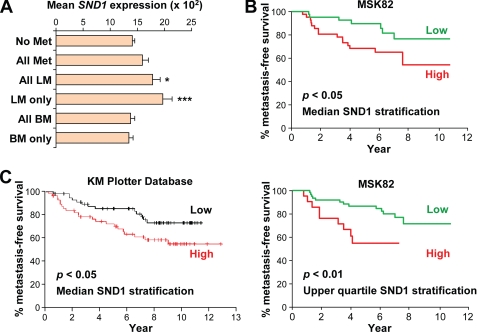
Metastasis is the deadliest and most poorly understood feature of malignant diseases. Recent work has shown that Metadherin (MTDH) is overexpressed in over 40% of breast cancer patients and promotes metastasis and chemoresistance in experimental models of breast cancer progression. Here we applied mass spectrometry-based screen to identify staphylococcal nuclease domain-containing 1 (SND1) as a candidate MTDH-interacting protein. After confirming the interaction between SND1 and MTDH, we tested the role of SND1 in breast cancer and found that it strongly promotes lung metastasis. SND1 was further shown to promote resistance to apoptosis and to regulate the expression of genes associated with metastasis and chemoresistance. Analyses of breast cancer clinical microarray data indicated that high expression of SND1 in primary tumors is strongly associated with reduced metastasis-free survival in multiple large scale data sets. Thus, we have uncovered SND1 as a novel MTDH-interacting protein and shown that it is a functionally and clinically significant mediator of metastasis.


Figures

FIGURE 1.
FIGURE 1.
Identification of SND1 as MTDH-interacting partner. A, lysates from LM2-MTDH-eGFP cells were immunoprecipitated with anti-eGFP and subjected to SDS-PAGE and Coomassie staining. Bands were sequenced by MALDI MS, and the indicated proteins were confirmed by MS/MS. B, MS/MS confirmation of an SND1 peptide. C, lysates from control or MTDH-KD LM2 cells (top) were immunoprecipitated with anti-MTDH and subjected to SDS-PAGE and silver staining (bottom). Bands specific to control cells (arrows) were identified by LC-MS/MS. D, lysates from control or MTDH-KD LM2 cells were immunoprecipitated with anti-MTDH and immunoblotted with the indicated antibodies. E, 293T cells were transfected with Myc-MTDH and either HA-SND1 or eGFP, and lysates were immunoprecipitated with anti-HA and immunoblotted with the indicated antibodies. WCL, whole cell lysate; RACK, receptor of activated protein kinase C; M, molecular mass standards.
FIGURE 2.
FIGURE 2.
Mapping of MTDH and SND1 domains of interaction. A, schematic of MTDH deletion mutant coding sequences and region required for MTDH-SND1 interaction (red box). +/− indicate whether the denoted sequence interacts with SND1. The locations of the transmembrane domain (TMD; amino acids 52–74) and three putative nuclear localization signals (NLS1–3; amino acids 79–91 for NLS1, amino acids 432–451 for NLS2, and amino acids 561–580 for NLS3) are marked by yellow and blue boxes, respectively. B, 293T cells were transfected with HA-SND1 and the indicated full-length (FL) or deletion mutant Myc-MTDH construct. Lysates were immunoprecipitated with anti-Myc and immunoblotted with the indicated antibodies. * indicates nonspecific bands. C, 293T cells were transfected with Myc-MTDH and the indicated full-length or deletion mutant HA-SND1 construct. Lysates were immunoprecipitated with anti-HA and immunoblotted with the indicated antibodies. D, LM2 cells were subjected to immunofluorescence analyses with the indicated antibodies to detect endogenous MTDH or SND1. E, for co-localization, LM2 cells were co-transfected with HA-SND1 and either eGFP-MTDH (top row) or eGFP (bottom row) and subjected to anti-HA immunofluorescence. Scale bar in D and E, 10 μm. WCL, whole cell lysate.
FIGURE 3.
FIGURE 3.
SND1 globally regulates metastatic and oncogenic signaling transcriptomic programs. A and B, SND1 was stably knocked down via shRNA in SCP28 and LM2 cells. The efficiency of SND1-KD was assessed at the RNA level via quantitative RT-PCR (A) and at the protein level via anti-SND1 immunoblotting (B). C, RNA harvested from vector or SND1-KD SCP28 cells was used for microarray analyses. Differentially expressed genes (n = 132) were used for hierarchical clustering and are displayed as a heat map. D–G, microarray data were used for GSEA. All gene sets from the C2 collection of the Molecular Signatures Database v3.0 passing the size threshold criteria (n = 2,484) were tested for enrichment in the list of genes ranked by expression change in SND1-expressing control SCP28 cells versus SND1-KD1 cells. GSEA plots of strongly enriched gene sets of relevance to metastasis and oncogenesis are displayed. The right panel in each figure shows the corresponding heat map of the differential expression of gene sets in the control and SND1-KD SCP28 cells. Ctrl, control; NES, normalized enrichment score. Data represent average ± S.E.
FIGURE 4.
FIGURE 4.
SND1 promotes lung metastasis in vivo. A and B, control and SND1-KD LM2 (A) and SCP28 (B) cells were xenografted into nude mice for experimental lung metastasis assays. Metastatic (met) burden was quantified by weekly whole body bioluminescence imaging. Representative images of mice from initial and late time points are displayed (lower panels). *, p < 0.05. C, whole lungs of mice used in LM2 experimental lung metastasis assays (top) and H&E staining of lung nodules (bottom). D, control and SND1-KD LM2 cells were used for mammary fat pad injections in nude mice, and primary tumor progression was measured over time via bioluminescence imaging and normalized to the signals at the start of the analysis. Scale bar in C, 500 μm. Data represent average ± S.E.
FIGURE 5.
FIGURE 5.
SND1 suppresses apoptosis and regulates expression of ALDH3A1 and KiSS1. A, modified Boyden chamber invasion assays using control or SND1-KD LM2 and SCP28 cells. B, in vitro growth curves of control or SND1-KD LM2 and SCP28 cells. C–E, control or SND1-KD LM2 and SCP28 cells were treated with either Adriamycin (Adr) or ethanol (control) and stained for apoptosis induction with M30 CytoDEATH. Flow cytometry (C) and immunofluorescence analyses (E) were used to monitor the extent of apoptosis induction. P2 indicates the apoptosis-positive populations. D, quantified data from apoptosis assays based on flow cytometry. F, expression of ALDH3A1 and KiSS1 in control or SND1-KD LM2 cells was determined via quantitative RT-PCR. G and H, KiSS1 promoter activity was assessed via a luciferase reporter assay of control versus SND1-KD LM2 cells (G) or control versus HA-SND1-transfected 293T cells (H). Scale bar in E, 50 μm. *, p < 0.05; **, p < 0.01. Ctrl, control. Data represent average ± S.E.
FIGURE 6.
FIGURE 6.
High SND1 expression correlates with increased risk of metastasis in breast cancer. A, expression of SND1 in primary tumors is shown in relevant subsets of breast cancer patients in the MSK-82 data set. Subsets include patients with either no metastasis (No Met) or metastasis to any organ (All Met), lung non-exclusively (All LM), lung exclusively (LM only), bone non-exclusively (BM), or bone exclusively (BM only). *, p < 0.05; ***, p < 0.001. B, Kaplan-Meier plot of metastasis-free survival of patients in the MSK-82 data set stratified by median (left) or upper quartile (right) SND1 expression. C, Kaplan-Meier plot of distant metastasis-free survival of node-positive patients stratified by median SND1 expression in the Kaplan-Meier Plotter breast cancer meta-analysis database. Data represent average ± S.E.

References

    1. Jemal A., Siegel R., Xu J., Ward E. (2010) CA Cancer J. Clin. 60, 277–300 - PubMed
    1. Nguyen D. X., Bos P. D., Massagué J. (2009) Nat. Rev. Cancer 9, 274–284 - PubMed
    1. Brown D. M., Ruoslahti E. (2004) Cancer Cell 5, 365–374 - PubMed
    1. Kang D. C., Su Z. Z., Sarkar D., Emdad L., Volsky D. J., Fisher P. B. (2005) Gene 353, 8–15 - PubMed
    1. Britt D. E., Yang D. F., Yang D. Q., Flanagan D., Callanan H., Lim Y. P., Lin S. H., Hixson D. C. (2004) Exp. Cell Res. 300, 134–148 - PubMed

Publication types

MeSH terms