. 2011 Jun 17;286(24):21191-202.
doi: 10.1074/jbc.M110.212290. Epub 2011 Apr 8.

Comparative kinetic and functional characterization of the motor domains of human nonmuscle myosin-2C isoforms

Affiliations

Comparative kinetic and functional characterization of the motor domains of human nonmuscle myosin-2C isoforms

Sarah M Heissler et al. J Biol Chem. .

Abstract

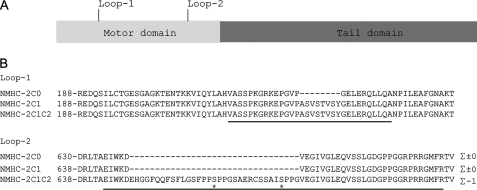
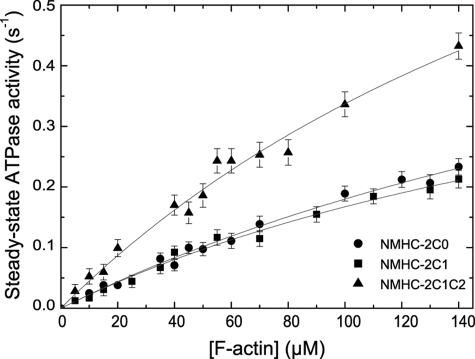
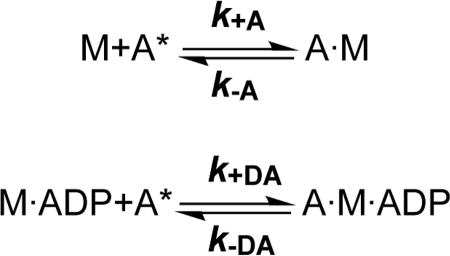
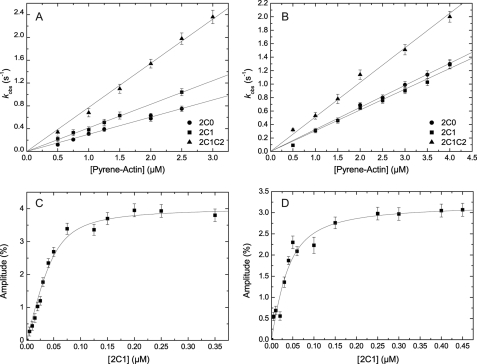
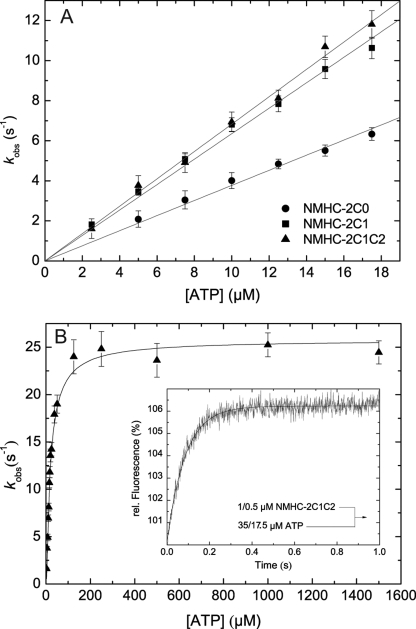
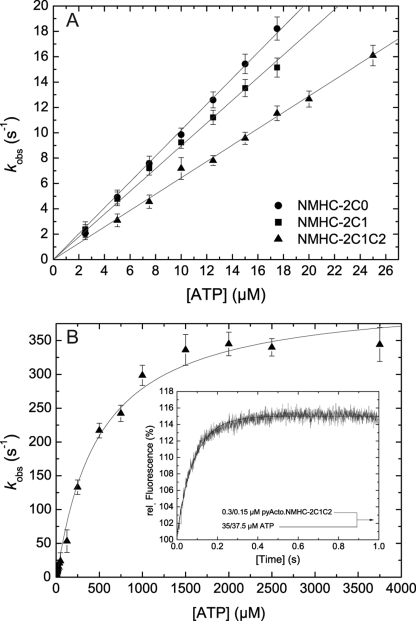
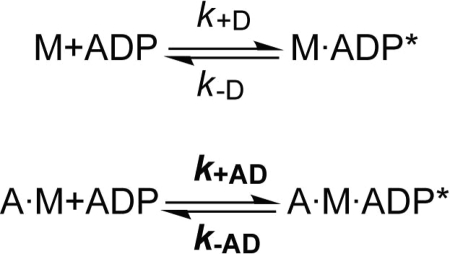
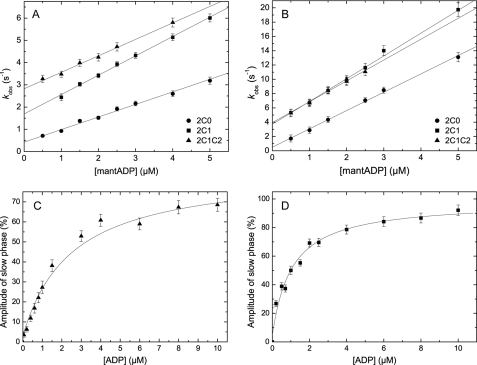
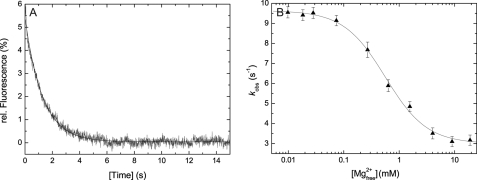
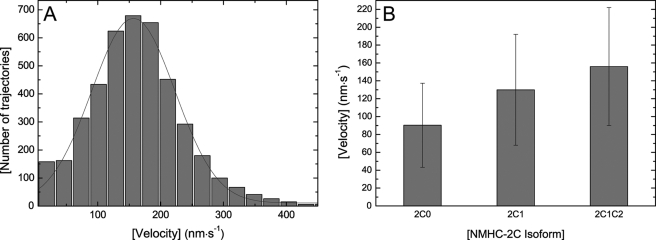
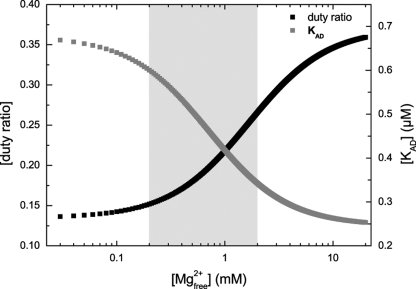
Nonmuscle myosins are widely distributed and play important roles in the maintenance of cell morphology and cytokinesis. In this study, we compare the detailed kinetic and functional characterization of naturally occurring transcript variants of the motor domain of human nonmuscle myosin heavy chain (NMHC)-2C. NMHC-2C is alternatively spliced both in loop-1 and loop-2. Isoform 2C0 contains no inserts in either of the loops and represents the shortest isoform. An 8-amino acid extension in the loop-1 region is present in isoforms 2C1 and 2C1C2. Isoform 2C1C2 additionally displays a 33-amino acid extension in the loop-2 region. Transient kinetic experiments indicate increased rate constants for F-actin binding by isoform 2C1C2 in the absence and presence of nucleotide, which can be attributed to the loop-2 extension. ADP binding shows only minor differences for the three transcript variants. In contrast, larger differences are observed for the rates of ADP release both in the absence and presence of F-actin. The largest differences are observed between isoforms 2C0 and 2C1C2. In the absence and presence of F-actin, isoform 2C1C2 displays a 5-7-fold increase in ADP affinity. Moreover, our results indicate that the ADP release kinetics of all three isoforms are modulated by changes in the concentration of free Mg(2+) ions. The greatest responsiveness of the NMHC-2C isoforms is observed in the physiological range from 0.2 to 1.5 mM free Mg(2+) ions, affecting their duty ratio, velocity, and tension-bearing properties.


Figures

FIGURE 1.
FIGURE 1.
A, schematic representation of human NMHC-2C showing the localization of loop-1 and loop-2 in the catalytically active motor domain. B, sequence alignment of the alternatively spliced loop-1 and -2 regions of human NMHC-2C isoforms (GenBankTM accession numbers NP_079005 (NMHC-2C0), NP_001070654 (NMHC-2C1), and NP_001139281 (NMHC-2C1C2)). Loop-1 and loop-2 consensus sequences are noted by underlines according to Golomb et al. (2). The 8-amino acid insertion in loop-1 of isoforms NMHC-2C1 and NMHC-2C1C2 increases the length of the loop. In contrast, the presence of the expanded loop-2 region in isoform NMHC-2C1C2 reduces the net charge of the surface loop to −1 when compared with NMHC-2C and -C1 (net charge 0). The net charge was calculated based on the assumption that the loop-2 sequence is a linear array of charged and uncharged residues. A value of +1 was assigned to positively charged amino acids (lysine and arginine), and a value of −1 was assigned to negatively charged amino acids (glutamic acid and aspartic acid). The remaining amino acids were assigned zero charge. The serine residues indexed with an asterisk in the loop-2 region of NMHC-2C1C2 are potential phosphorylation sites as determined by KinasePhos (61).
SCHEME 1
SCHEME 1
FIGURE 2.
FIGURE 2.
Actin-activated steady-state ATPase activity of human nonmuscle myosin-2C isoforms. The ATPase activities were determined with the NADH-coupled assay in the presence of an ATP-regenerating system. The resulting activities were plotted against [F-actin] and fitted to the Michaelis-Menten equation. Maximal activities of >0.23, >0.21, and >0.43 s−1 were approximated at 140 μm F-actin. The displayed data are corrected for the basal ATPase activity of myosin. Experimental conditions were as follows: 25 °C, 25 mm HEPES (pH 7.4), 5 mm MgCl2, and 0.5 mm DTT.
SCHEME 2
SCHEME 2
FIGURE 3.
FIGURE 3.
Actin interaction. A, kinetics of myosin binding to pyrene-labeled F-actin. Increasing concentrations of pyrene actin were rapidly mixed with 0.15 μm NMHC-2C isoforms in a stopped-flow spectrophotometer. The second-order rate constants (k+A) were obtained from the ascending slopes. Values of 0.30 ± 0.03, 0.41 ± 0.03, and 0.77 ± 0.04 μm−1 s−1 were obtained for 2C0, 2C1, and 2C1C2. B, [pyrene-actin] dependence of the observed rate constants (kobs) for NMHC-2C·ADP binding to pyrene-actin filaments. Linear approximation gives a k+DA of 0.33 ± 0.003, 0.31 ± 0.006, and 0.51 ± 0.01 μm−1 s−1 for 2C0, 2C1, and 2C1C2, respectively. C, affinity titration of pyrene-actin for 2C1. 50 nm pyrene-labeled F-actin was incubated with 0.005 to 0.35 μm NMHC-2C1 before rapid mixing with 10 μm ATP. The amplitude of the ATP-induced dissociation increased with increasing NMHC-2C1, and quadratic fit to the data gives KA of 13±5 nm. D, affinity titration of pyrene-actin and 2C1·ADP. 30 nm pyrene-actin was preincubated with 0.005–0.3 μm myosin in the presence of 30 μm ADP, and the ternary complex was rapidly dissociated with 300 μm ATP. Quadratic approximation of the data set gives KDA of 18±13 nm.
SCHEME 3
SCHEME 3
FIGURE 4.
FIGURE 4.
Kinetics of ATP binding to NMHC-2C isoforms. A, ATP binding to nonmuscle myosin-2C isoforms was measured by monitoring the increase in tryptophan fluorescence. At low [ATP], kobs depends linearly on the nucleotide concentration defining the second-order rate constant K1k+2 to 0.37 ± 0.01, 0.66 ± 0.01, and 0.68 ± 0.01 μm−1s−1 for 2C0, 2C1, and 2C1C2, respectively. B, dependence of kobs on [ATP] fitted to a hyperbolic function for isoform 2C1C2. The approximation approached a value k+3+k−3 of 25.79 ± 0.5 s−1, whereas half-saturation is reached at 1/K1 = 16.1 ± 1.98 μm. Inset, stopped-flow record after mixing 0.5 μm 2C1C2 with 17.5 μm ATP approximated with a mono-exponential function yielding a kobs of 11.81 s−1.
SCHEME 4
SCHEME 4
FIGURE 5.
FIGURE 5.
Kinetics of ATP binding to actomyosin. A, ATP induced dissociation of actomyosin. The resulting observed rate constants (kobs) depend linearly on the ATP concentration. Linear regression defines the apparent second-order rate constant of ATP binding (K1k+2) to 1.02 ± 0.01, 0.89 ± 0.01, and 0.64 ± 0.01 μm−1s−1 for 2C1, 2C1, and 2C1C2, respectively. B, at high [ATP], the observed rate constants can be described by a hyperbola. In the shown example of 2C1C2, the observed rate constants converge k+2 = 417.0 ± 14 s−1 with half-saturation at 1/K1 = 484.4 ± 57.8 μm. Inset, representative time course of pyrene-actin fluorescence enhancement after mixing 0.15 μm pyrene-acto·2C1C2 and 17.5 μm ATP yielding a kobs of 11.53 s−1.
SCHEME 5
SCHEME 5
FIGURE 6.
FIGURE 6.
ADP interaction. A, kinetics of mant-ADP binding to myosin. Individual data sets were fit to a linear equation, yielding the second-order rate constant k+D of 0.54 ± 0.02, 0.87 ± 0.02, and 0.73 ± 0.03 μm−1 s−1 for 2C0, 2C1, and 2C1C2. The corresponding dissociation rate constants k−D provided by the y intercept are 0.46 ± 0.05, 1.66 ± 0.06, and 2.83 ± 0.06 s−1 for 2C0, 2C1, and 2C1C2. B, kinetics of mant-ADP binding to actomyosin. The second-order rate binding constant as deduced from the plot are as follows: 2.56 ± 0.06, 3.18 ± 0.11, and 2.91 ± 0.19 μm−1 s−1 for 2C0, 2C1, and 2C1C2. Extrapolation of the slopes to zero [mant-ADP] defines the individual dissociation rate constants k−AD to 0.5 ± 0.16, 3.7 ± 0.31, and 2.91 ± 0.19 s−1 for 2C0, 2C1, and 2C1C2. C, determination of the dissociation equilibrium constant KD of 2C1C2. The secondary plot shows the [ADP] dependence of the amplitude of the slow phase that is obtained after mixing 0.16 μm 2C1C2 in the presence of changing concentrations of ADP (1–10 μm) with excess ATP (500 μm). The plot of the observed amplitude of the slow phase versus [ADP] follows a hyperbolic function and defines KD to 2.51 ± 0.63 μm. D, influence of ADP on the ATP-induced dissociation of acto·2C1. 0.25 μm pyrene-acto·2C1 was preincubated with varying ADP concentrations, and the complex was rapidly dissociated with 1000 μm ATP. The dependence of the amplitude of the slow phase versus [ADP] was fitted to a hyperbola with an apparent KAD of 1.04 ± 0.17 μm.
FIGURE 7.
FIGURE 7.
Mg2+ dependence of ADP release from actomyosin. A, representative time course upon mixing 0.15 μm acto·2C0 and 2.5 μm mant-ADP with excess ATP (500 μm). A mono-exponential approximation gives k−AD = 0.78 ± 0.01 s−1. B, impact of free Mg2+ ion concentration on the ADP release rate from acto·2C1C2. Increasing the free Mg2+ ion concentration from 0.01 to 19.0 mm results in an almost 3-fold decrease in the rate of enzymatic activity.
FIGURE 8.
FIGURE 8.
In vitro motility assay. A, actin gliding velocity distribution of 2C1C2. An average sliding velocity of 156 ± 66 nm·s−1 was determined. B, distribution of the in vitro gliding velocities of NMHC-2C isoforms. Experimental conditions were as follows: 25 mm imidazole (pH 7.4), 25 mm KCl, 1 mm MgCl2, 1 mm EGTA, 4 mm ATP in the presence of an oxygen scavenging system at 30 °C. Error bars indicate the sample standard deviation.
FIGURE 9.
FIGURE 9.
Schematic diagram, illustrating the consequences of the magnesium sensitivity on the ADP affinity of the actomyosin complex (KAD) and the duty ratio of isoform 2C0. Depicted is the dependence of KAD (gray squares) and the duty ratio (black squares) on free Mg2+ in the concentration range between 0.01 and 20 mm. The ordinate on the left represents the duty ratio, whereas the ordinate on the right refers to KAD. KAD was calculated from the ratio k−AD/k+AD under the assumption that k+AD is constant. The data for k−AD were extracted from the regression of the kobs versus Mg2+ plot as depicted in Fig. 7B. The duty ratio was calculated as follows (duty ratio = (kcat/k−AD)), based on a constant value for kcat of 0.23 s−1. Changes within the physiological range of free Mg2+ ion concentrations (0.2 to 2 mm, highlighted in gray) produce the greatest response in the duty ratio and KAD.

References

    1. Berg J. S., Powell B. C., Cheney R. E. (2001) Mol. Biol. Cell 12, 780–794 - PMC - PubMed
    1. Golomb E., Ma X., Jana S. S., Preston Y. A., Kawamoto S., Shoham N. G., Goldin E., Conti M. A., Sellers J. R., Adelstein R. S. (2004) J. Biol. Chem. 279, 2800–2808 - PubMed
    1. Simerly C., Nowak G., de Lanerolle P., Schatten G. (1998) Mol. Biol. Cell 9, 2509–2525 - PMC - PubMed
    1. Maupin P., Phillips C. L., Adelstein R. S., Pollard T. D. (1994) J. Cell Sci. 107, 3077–3090 - PubMed
    1. Jana S. S., Kawamoto S., Adelstein R. S. (2006) J. Biol. Chem. 281, 24662–24670 - PubMed

Publication types

LinkOut - more resources