. 2011 Aug;39(14):5893-906.
doi: 10.1093/nar/gkr209. Epub 2011 Apr 7.

Long-range chromatin interactions at the mouse Igf2/H19 locus reveal a novel paternally expressed long non-coding RNA

Affiliations

Long-range chromatin interactions at the mouse Igf2/H19 locus reveal a novel paternally expressed long non-coding RNA

Franck Court et al. Nucleic Acids Res. 2011 Aug.

Abstract

Parental genomic imprinting at the Igf2/H19 locus is controlled by a methylation-sensitive CTCF insulator that prevents the access of downstream enhancers to the Igf2 gene on the maternal chromosome. However, on the paternal chromosome, it remains unclear whether long-range interactions with the enhancers are restricted to the Igf2 promoters or whether they encompass the entire gene body. Here, using the quantitative chromosome conformation capture assay, we show that, in the mouse liver, the endodermal enhancers have low contact frequencies with the Igf2 promoters but display, on the paternal chromosome, strong interactions with the intragenic differentially methylated regions 1 and 2. Interestingly, we found that enhancers also interact with a so-far poorly characterized intergenic region of the locus that produces a novel imprinted long non-coding transcript that we named the paternally expressed Igf2/H19 intergenic transcript (PIHit) RNA. PIHit is expressed exclusively from the paternal chromosome, contains a novel discrete differentially methylated region in a highly conserved sequence and, surprisingly, does not require an intact ICR/H19 gene region for its imprinting. Altogether, our data reveal a novel imprinted domain in the Igf2/H19 locus and lead us to propose a model for chromatin folding of this locus on the paternal chromosome.


Figures

Figure 1.
Figure 1.
Long-range interactions with endodermal enhancers at the Igf2/H19 locus in the mouse liver. (A) Schematic representation of the mouse Igf2/H19 locus. Exons of the Igf2 and H19 genes (black boxes) are displayed together with the downstream endodermal enhancers (black ovals), the centrally conserved domain (CCD; DNase I hypersensitive sites, white box) (41) and the ICR. A matrix attachment region (MAR3; white box) and the differentially methylated regions 1 and 2 (DMR1 and DMR2; grey lollipops) are also depicted. The Igf2 promoters (P0, P1, P2 and P3) are indicated by arrows, BamHI restriction sites by vertical lines and sites investigated in 3C assays by white arrows. The primer used as the anchor (close to BamHI site 0 and to the endodermal enhancers) is represented by a black arrow. (B) The graph represents the measured relative interaction frequencies between the endodermal enhancers (anchor/BamHI site 0) and each of the BamHI sites investigated as a function of the genomic distances (in bp). Data were collected from samples issued from 7-days-old (white circles) or 30-days-old (black diamonds) mouse livers. Parts of the graph that are included into the noise band or those that reflect the side effect are shadowed in grey. Error bars represent SEM of three independent 3C assays.
Figure 2.
Figure 2.
Interactions between endodermal enhancers and Igf2 DMRs are paternal-chromosome specific. (A) Schematic representation of the mouse Igf2/H19 locus showing the locations of the ΔDMR1-U2, ΔDMR2 and H19Δ13 deletions. The genomic elements depicted are as indicated in Figure 1A. (B–D) The graph represents the measured relative interaction frequencies between the endodermal enhancers (anchor/BamHI site 0) and each of the BamHI sites investigated as a function of the genomic distances (in bp). Data were collected from 7-days-old mouse liver samples issued from wild-type animals (white circles in panels B–D) or from mutant strains carrying either a paternal inheritance of the ΔDMR1-U2, ΔDMR2 or H19Δ13 deletions (grey triangles in panels B, D and E, respectively) or a maternal inheritance of the ΔDMR1-U2 or H19Δ13 deletions (black squares in panel C and E, respectively). The noise band is shadowed in grey. Error bars represent SEM of three independent 3C assays.
Figure 3.
Figure 3.
The intergenic Igf2/H19 region interacts with the Igf2 gene body but not the DMRs. (A) Schematic representation of the mouse Igf2/H19 locus. The anchor (BamHI site 10) is indicated as a black arrow. The position of a mesodermic enhancer (cs9; grey oval) is also shown. The other genomic elements depicted are as indicated in Figure 1A. (B) The graph represents the measured relative interaction frequencies between the intergenic region (anchor/BamHI site 10) and each of the BamHI sites investigated as a function of the genomic distances (in bp). Data were collected from samples issued from 7-days-old wild-type mouse livers (white circles). Parts of the graph that are included into the noise band or those that reflect the side effect are shadowed in grey. Error bars represent SEM of two independent 3C assays.
Figure 4.
Figure 4.
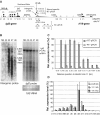
The Igf2/H19 intergenic region that interacts with the endodermal enhancers is transcribed. (A) Schematic representation of the Igf2/H19 locus showing the location of the northern blot probes and RT–PCR primers used to characterize the intergenic transcripts. The transcribed intergenic region is depicted in grey and several genomic elements are also indicated. Except opposite statement, all positions given in the Result section or in the figure are intended relative to BamHI site 11, located at chr7: 149.817.140 on mouse July 2007/mm9 assembly. (B) Northern blots showing the expression patterns of the intergenic region (left panel) or the Igf2 mRNAs (right panel). Total RNAs were prepared from newborn (NB) livers or from post-natal (d2, d5, d7 and d9) mouse livers and analysed by Ethidium bromide staining of the agarose/formaldehyde gel (lower panel on the right) before being transferred to a nylon membrane and hybridized by an intergenic probe (left panel). As a quality control of RNA preparations, the same membrane was subsequently re-hybridized with an Igf2 probe (upper panel on the right). The position of the Igf2 P1 and P3 mRNA transcripts (the P2 transcript has very low expression levels in liver) and of the 28S and 18S rRNA (3.8 and 1.8 kb, respectively) are indicated. (C) The relative expression levels of intergenic transcripts (black bars) were determined by RT–qPCR at increasing genomic positions as indicated on the figure. Control reactions with no reverse transcription (−RT) have also being quantified (grey bars). Data was quantified relative to Gapdh mRNA levels and normalized to the higher RNA level quantified in the series. Liver sample is from d7 mice; the other samples were prepared from newborn mice. (D) Intergenic transcripts were quantified by RT–qPCR at three distinct genomic positions (+0.26, +11.1 and +14.4 kb) in mouse liver samples at the following developmental stages: embryos 17.5 and 18.5 dpc (e17.5 and e18.5), newborn (NB), post-natal Day 2, 5, 6, 8, 11, 13, 17, 18, 34 (d2–d34). In panels B and C, error bars represent s.e.m. of quantifications performed on two independent RT reactions. Data were normalized as described above. RT–qPCR primer sequences are given in the Supplementary Table S2.
Figure 5.
Figure 5.
Analysis of intergenic transcription in several mouse tissues. (A) The relative expression levels of the PIHit (dark grey bars) or Igf2 (light grey bars) RNAs were measured by RT–qPCR in samples issued from newborn (kidney, heart, tongue and brain) or post-natal d7 (liver) hybrid mice (issued from a cross between SD7 females and M. musculus domesticus males). Data are normalized relative to Gapdh mRNA levels. (B) Allelic expression levels of the PIHit RNA were determined by allele-specific RT-qPCR in the above mentioned samples. Error bars represent SEM of quantifications performed on two independent RT reactions.
Figure 6.
Figure 6.
The PIHit RNA is a novel imprinted non-coding RNA. (A) The relative allelic expression levels were quantified by allele-specific RT-qPCR on total RNA from liver of hybrid mice issued from a cross between M. musculus domesticus (C57BL6/CBA F1) females and SDP711 males (upper right panel) or the reverse cross (SDP711 female X M. m. domesticus males) (upper left panel). SDP711 is a congenic mouse strain where the distal part of chromosome 7 and the proximal part of chromosome 11 are of Mus spretus origin. Data were normalized relative to Gapdh mRNA levels. Error bars represent SEM of quantifications performed on two independent RT reactions. The experiment was repeated at three distinct genomic sites (−0.07, +5.2 and +8.2 kb). All the data were combined by calculating the mean expression levels of each allele in both crosses to be finally presented into a single graph (lower panel). The relative allelic expression levels of the Igf2 mRNA (B) or PIHit (C) were determined by allele-specific RT–qPCR on hybrid mice with paternal or maternal inheritance of the H19Δ13 deletion. Error bars represent SEM of quantifications performed on two independent RT reactions. Sequences of primers used in allele-specific RT–qPCR experiments are given in the Supplementary Table S8.
Figure 7.
Figure 7.
Mapping of a discrete differentially methylated region at PIHit locus. (A) The figure displays the PIHit locus into a UCSC Genome Browser window obtained on the mouse July 2007/mm9 assembly (chr7:149 800 531–149 818 019). It shows the sequence conservation index (‘Mammal Cons.’ lane) and the location of repeats (black boxes; ‘RepeatMasker’ lane). One can note that the HRS2 contains a sequence (chr7:149 812 622–149 812 856) that is highly conserved in mammals (black vertical arrow). The positions of the PIHit DMR (see below) and of a CpG-rich sequence (CpG1) are indicated below the UCSC window. The transcribed region is depicted in grey. (B) The methylation pattern of the HRS2 sequence was determined in the 7-days-old mouse liver by bisulphite sequencing. The mean methylation levels (%) of each CpG of the PIHit DMR are indicated on the figure. A discrete differentially methylated region (PIHit DMR), containing only three CpG and corresponding to a sequence highly conserved in mammals (see above), is significantly more methylated on the maternal than on the paternal chromosome (P = 0.0233; n = 54; Mann–Whitney U-test). No significant difference was found outside this region (P = 0.1539; n = 54; Mann–Whitney U-test). (C) Allelic methylation levels of the PIHit DMR were estimated in the mouse liver, at the indicated developmental stages (NB: newborn), by digestion of the genomic DNA with the methylation-sensitive BceAI restriction enzyme and quantifications by allele-specific qPCR. Noteworthy, this BceAI site encompasses the CpG dinucleotide that displayed the strongest difference of allelic methylation in the bisulphite experiment (58/26%) (Figure 7B). Error bars represent SEM of quantifications performed on at least two independent BceAI digestions.
Figure 8.
Figure 8.
Model for tri-dimensional folding of the mouse Igf2/H19 locus on the paternal allele. This model is based on the 3C-qPCR data obtained in the 7-days-old mouse liver (Figures 1–3). On the paternal chromosome, the endodermal enhancers, located downstream the H19 gene, interact either with the Igf2 DMRs or with the PIHit locus. These two types of interactions appear to be exclusive, suggesting that they are hampering each other. Therefore, we propose that two alternative chromatin hubs (grey ovals) may occur at this locus on the paternal chromosome. In the first one, the enhancers would interact with the methylated Igf2 DMRs leading to high Igf2 gene expression. A second type of chromatin hub would form when the PIHit locus is entering the hub to interact with the enhancers resulting in PIHit RNA expression and exclusion of the Igf2 DMR, thus contributing to fine tuning of Igf2 expression. These distinct chromatin hubs may form either stably, via chromatin loops, in two separate liver cell populations or they may occur in a more dynamic way through transient but specific interactions that take place in the whole cell population analysed. Note that, according to this model, both ends of the Igf2/H19 locus and a region downstream of the PIHit sequence are found in close spatial vicinity. Interestingly, in the human, chromatin folding on the paternal chromosome is mediated through a network of CTCF/Cohesin contacts that involves these three regions (18).

References

    1. Gabory A, Ripoche MA, Le Digarcher A, Watrin F, Ziyyat A, Forné T, Jammes H, Ainscough JF, Surani MA, Journot L, et al. H19 acts as a trans regulator of the imprinted gene network controlling growth in mice. Development. 2009;136:3413–3421. - PubMed
    1. Varrault A, Gueydan C, Delalbre A, Bellmann A, Houssami S, Aknin C, Severac D, Chotard L, Kahli M, Le Digarcher A, et al. Zac1 regulates an imprinted gene network critically involved in the control of embryonic growth. Dev. Cell. 2006;11:711–722. - PubMed
    1. Szabo P, Tang SH, Rentsendorj A, Pfeifer GP, Mann JR. Maternal-specific footprints at putative CTCF sites in the H19 imprinting control region give evidence for insulator function. Curr. Biol. 2000;10:607–610. - PubMed
    1. Bell AC, Felsenfeld G. Methylation of a CTCF-dependent boundary controls imprinted expression of the Igf2 gene. Nature. 2000;405:482–485. - PubMed
    1. Hark AT, Schoenherr CJ, Katz DJ, Ingram RS, Levorse JM, Tilghman SM. CTCF mediates methylation-sensitive enhancer-blocking activity at the H19/Igf2 locus. Nature. 2000;405:486–489. - PubMed

Publication types