. 2011 Apr;23(4):1494-511.
doi: 10.1105/tpc.110.074278. Epub 2011 Apr 8.

Multilevel control of Arabidopsis 3-hydroxy-3-methylglutaryl coenzyme A reductase by protein phosphatase 2A

Affiliations

Multilevel control of Arabidopsis 3-hydroxy-3-methylglutaryl coenzyme A reductase by protein phosphatase 2A

Pablo Leivar et al. Plant Cell. 2011 Apr.

Abstract

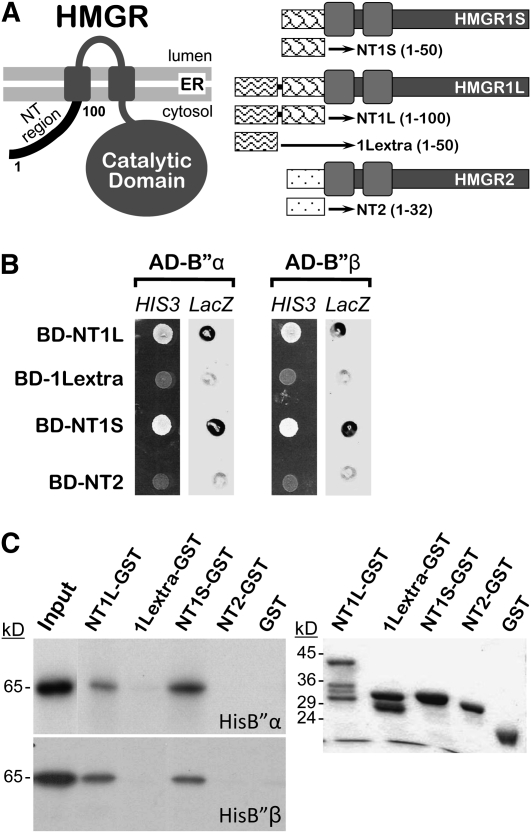
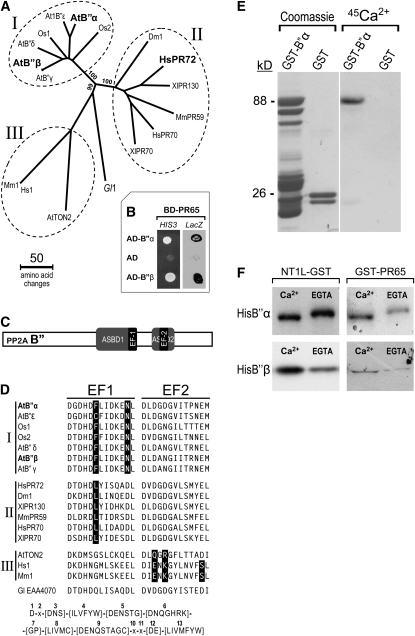
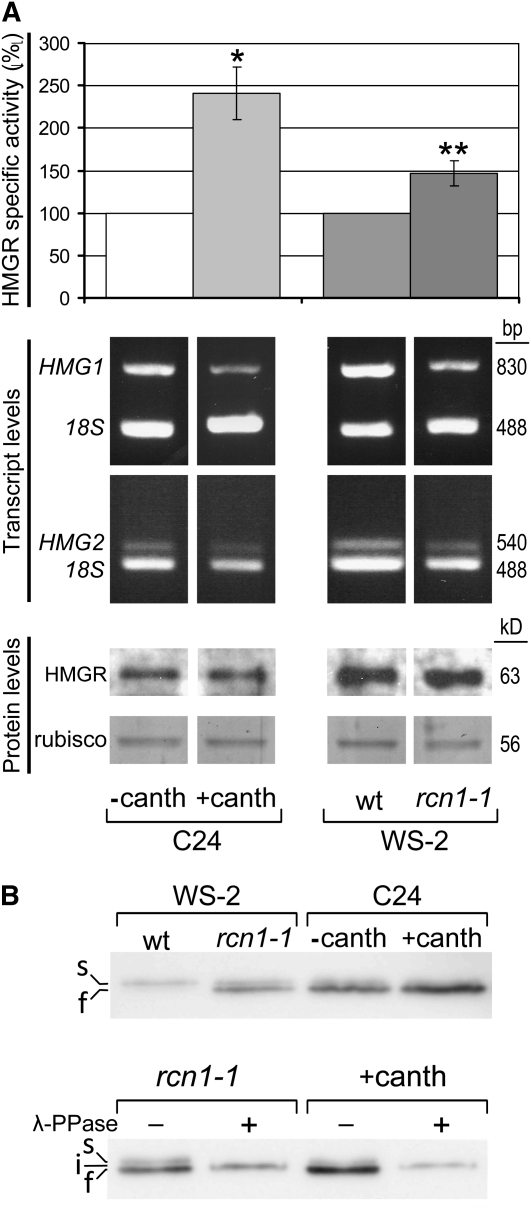
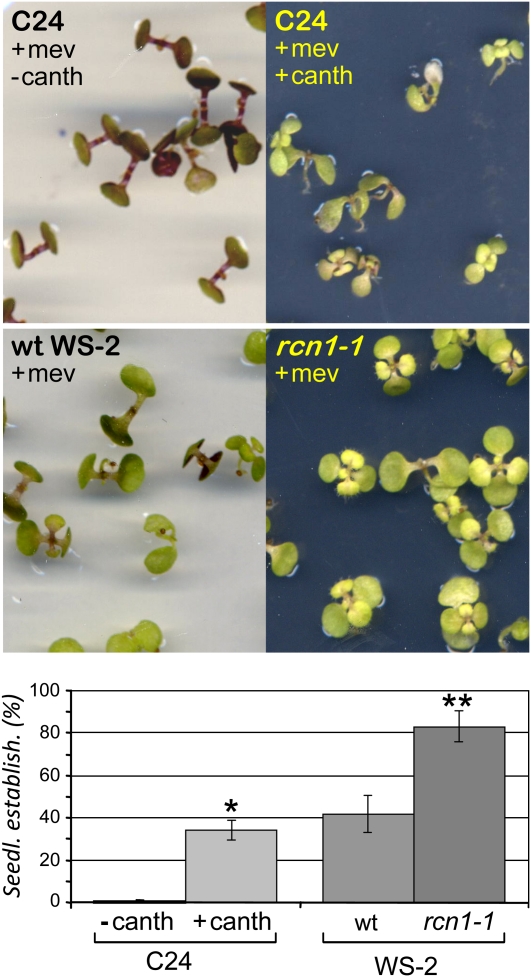
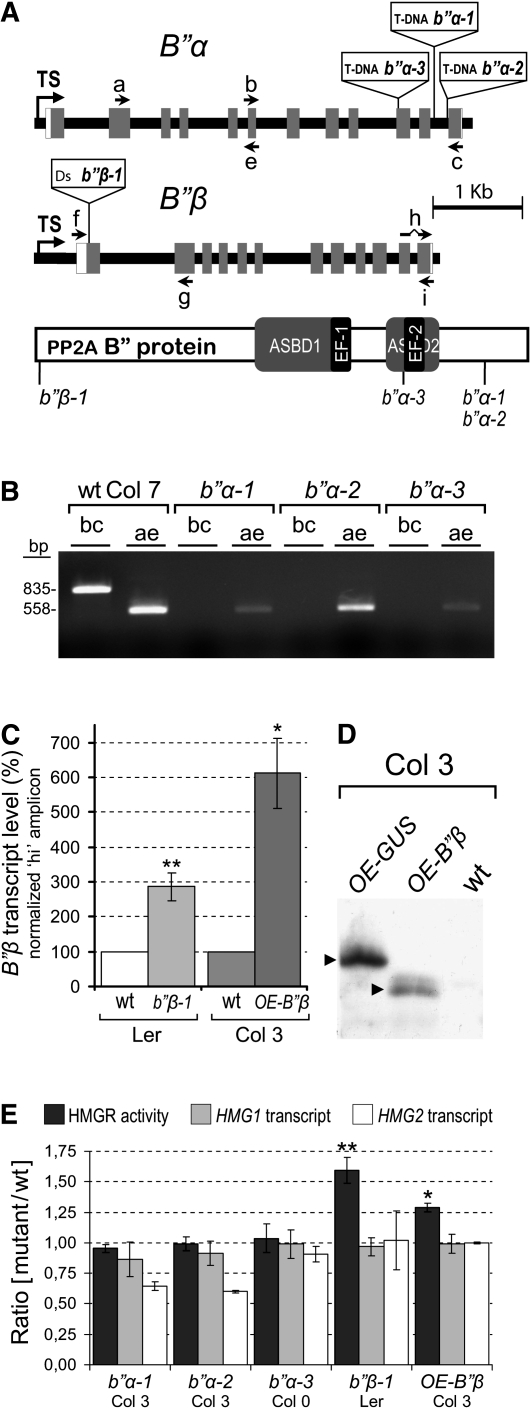
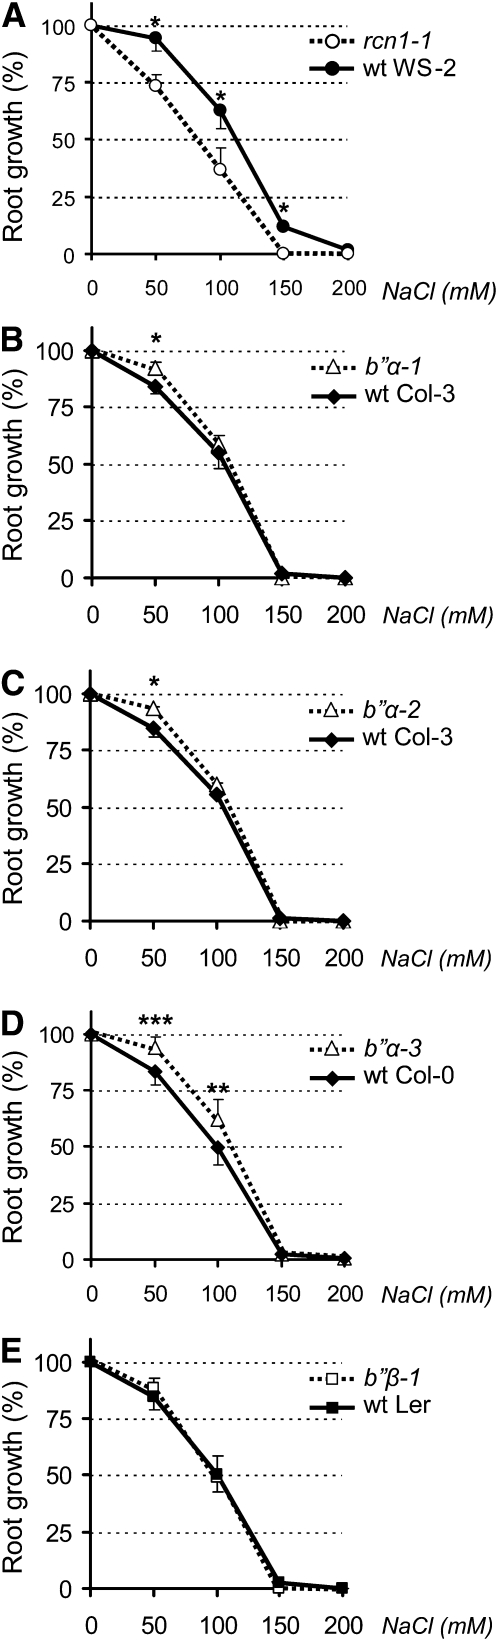
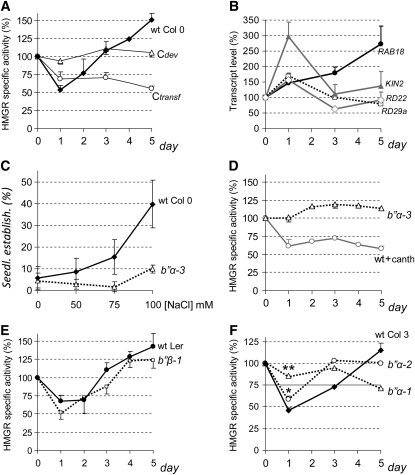
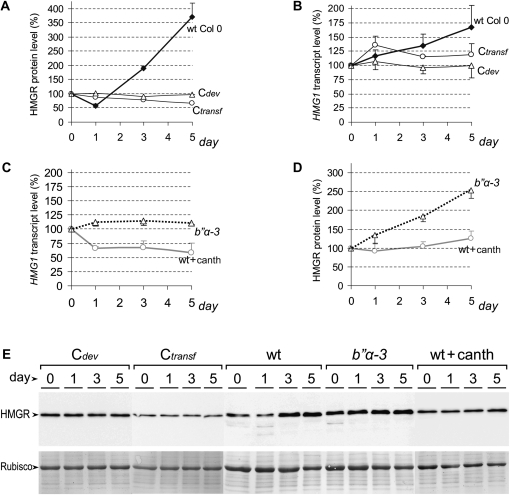
Plants synthesize a myriad of isoprenoid products that are required both for essential constitutive processes and for adaptive responses to the environment. The enzyme 3-hydroxy-3-methylglutaryl-CoA reductase (HMGR) catalyzes a key regulatory step of the mevalonate pathway for isoprenoid biosynthesis and is modulated by many endogenous and external stimuli. In spite of that, no protein factor interacting with and regulating plant HMGR in vivo has been described so far. Here, we report the identification of two B'' regulatory subunits of protein phosphatase 2A (PP2A), designated B''α and B''β, that interact with HMGR1S and HMGR1L, the major isoforms of Arabidopsis thaliana HMGR. B''α and B''β are Ca²⁺ binding proteins of the EF-hand type. We show that HMGR transcript, protein, and activity levels are modulated by PP2A in Arabidopsis. When seedlings are transferred to salt-containing medium, B''α and PP2A mediate the decrease and subsequent increase of HMGR activity, which results from a steady rise of HMGR1-encoding transcript levels and an initial sharper reduction of HMGR protein level. In unchallenged plants, PP2A is a posttranslational negative regulator of HMGR activity with the participation of B''β. Our data indicate that PP2A exerts multilevel control on HMGR through the five-member B'' protein family during normal development and in response to a variety of stress conditions.


Figures

Figure 1.
Figure 1.
Interaction of HMGR1L and HMGR1S with B′′α and B′′β. (A) Schematic representation and topology in the membrane of Arabidopsis HMGR isoforms, depicting N-terminal fragments used in the two-hybrid analysis. The amino acid positions delimiting protein fragments are indicated in parentheses. (B) Two-hybrid analysis in yeast. Cells from strain Y190 were cotransformed with a pACT2 derivative encoding AD-B′′α or AD-B′′β and a pAS2-1 derivative encoding BD-NT1L, BD-1Lextra, BD-NT1S, or BD-NT2. Interaction between the assayed partners was confirmed by the occurrence of growth on selective medium without His (HIS3 lanes) and β-galactosidase activity (LacZ lanes). (C) In vitro GST pull-down analysis. Equivalent amounts of radiolabeled in vitro–synthesized HisB′′α or HisB′′β were incubated with the bait NT1L-GST, 1Lextra-GST, NT1S-GST, or NT2-GST or subjected directly to electrophoresis (Input). Fluorograms of the radiolabeled products retained by the indicated resins are shown on the left, whereas a Coomassie blue–stained gel with the GST fusions used in the assay is shown on the right.
Figure 2.
Figure 2.
Characterization of the B′′ PP2A Protein Family. (A) Phylogenetic analysis of eukaryotic B′′ PP2A subunits. The branching points leading to three groups were highly significant, since they occurred in 99 or 100% of 1000 bootstrap replicates, as indicated. The first two letters of the sequence names refer to the organism. At, Arabidopsis thaliana; Dm, Drosophila melanogaster; Gl, Giardia lamblia; Hs, Homo sapiens; Mm, Mus musculus; Os, Oryza sativa; Xl, Xenopus laevis. A text file of the sequence alignment used in this analysis is available as Supplemental Data Set 1 online. (B) Two-hybrid analysis. Yeast cells from strain Y190 were cotransformed with a pAS2-1 derivative encoding BD-PR65 and either control pACT2 plasmid encoding AD or pACT2 derivatives encoding AD fused to B′′α or B′′β. Growth on selective medium without His (HIS3 lane) or staining after β-galactosidase assay (LacZ lane) indicates positive interaction. BD-PR65 corresponds to the A2 (pDF1) variant of PR65. (C) Schematic representation of the B′′ PP2A subunit. Positions of ASBD and EF-hand motifs are indicated, keeping proportionality with that of the actual primary sequence. (D) Comparison of the EF-hand motifs. Sequences corresponding to the two EF-hand motifs of B′′ subunits were aligned and compared with the EF-hand consensus (PROSITE entry PS00018) shown at the bottom. EF1 and EF2 correspond to positions 330 to 342 and 403 to 515 of B′′α, and 327 to 339 and 400 to 412 of B′′β, respectively. Residues that do not fit the consensus are represented in white over black background. B′′ sequences were classified in three groups, as indicated on the left, according to divergence of EF1 and EF2 from consensus. The first two letters of the sequence names refer to the organism as in Figure 2A. (E) Ca2+ binding assay. GST-B′′α and GST produced in E. coli were partially purified by glutathione affinity chromatography. Shown are a Coomassie blue–stained gel of the eluted fractions (left) and an autoradiogram of equivalent samples (right) after electroblotting and incubation of the PVDF membrane with 45Ca2+. (F) Ca2+-dependent in vitro binding and band shift assays. Radiolabeled in vitro–synthesized HisB′′α or HisB′′β were incubated with matrices containing NT1L-GST or GST-PR65 bait in the presence of 5 mM Ca2+ or 5 mM EGTA. Equivalent volumes of eluted samples were subjected to SDS-PAGE (10% acrylamide) and fluorography. GST-PR65 corresponds to the A3 (pDF2) variant of PR65.
Figure 3.
Figure 3.
Posttranslational Regulation of HMGR by PP2A. (A) HMGR transcript, protein, and activity levels. Arabidopsis C24, WS-2 wild-type (wt), and WS-2 rcn1-1 mutant seedlings were grown for 3 to 4 weeks under short-day conditions in MS medium alone or in MS medium containing 10 μM cantharidin as indicated. The HMGR activity (top panel) is represented as the percentage with respect to the C24 (three experiments) or WS-2 wild-type sample (five experiments), indicating the average values and the corresponding sd. The HMGR-specific activity (pmol HMG-CoA/min*mg) was 2.33 ± 0.88 for C24 and 1.99 ± 0.34 for WS-2 wild type. Asterisks indicate levels of statistical significance as determined for Student’s t test: *P < 3 10−3 for +canth versus −canth; **P < 3 10−4 for rcn1-1 versus the wild type. The HMG1 and HMG2 transcript levels (middle panel) were estimated by quantitative PCR and agarose gel electrophoresis using the amplification product of 18S rRNA (18S) as an internal reference. The protein levels (bottom panel) were estimated by immunoblot with the anti-CD1-i antibody using the Coomassie blue–stained Rubisco band of the same filter as a normalization reference. The sizes of the PCR products (pb) or proteins (kD) are indicated on the right. (B) Phosphorylation status of HMGR. The above protein samples were subjected to SDS-PAGE (top gel) or incubated in the presence (+) or absence (−) of protein phosphatase from phage λ (λ-PPase), as indicated, prior to SDS-PAGE (bottom gel). Electrophoresis was performed in 9% acrylamide mini gels with 8 mA constant current. HMGR was detected by immunoblot with the anti-CD1-i antibody. s, i, f: slow-, intermediate-, and fast-migrating HMGR bands.
Figure 4.
Figure 4.
Regulation of HMGR by PP2A in Planta. Arabidopsis C24, WS-2 wild-type (wt), and WS-2 rcn1-1 mutant seedlings were grown for 15 d under long-day conditions in MS medium containing 5 μM mevinolin or 5 μM mevinolin and 10 μM cantharidin as indicated. The resistance to mevinolin is represented in the bottom panel as the percentage of seedling establishment (Seedl. establish.). The bars indicate the mean values and the corresponding sd of three independent experiments, with at least 60 plants per experimental condition. Asterisks indicate levels of statistical significance as determined for Student’s t test: *P < 2 10−4 for +canth versus −canth; **P < 10−6 for rcn1-1 versus the wild type.
Figure 5.
Figure 5.
Characterization of b′′α and b′′β Mutants. (A) The disrupted B′′ genes. Gene structure is drawn to scale, but the inserted T-DNA (8.0 kb) and Ds transposable element (6.6 kb) are only indicated. Black line, gene-flanking sequences and introns; white boxes, transcribed nontranslated regions; gray boxes, coding exons; TS, transcription start site. Arrows a to i show the annealing position of primers. The crooked line of primer h represents a missing intron sequence. A protein scheme with disruption points corresponding to the above insertions is shown at the bottom. The conserved ASBD and EF-hand motifs are indicated. (B) RT-PCR analysis of b′′α-1, b′′α-2, and b′′α-3 mutants. The bc and ae primer sets were used to detect the corresponding B′′α transcript regions in total RNA from B′′α mutant and wild-type (wt) control seedlings. The size of the amplicons (bp) is indicated to the left of the agarose gel. (C) B′′β transcript levels in b′′β-1 and OE-B′′β mutants. Total RNA was extracted from b′′β-1, OE-B′′β , and the corresponding wild-type seedlings, grown in MS medium for 14 d under long-day conditions. The B′′β transcript level was measured by qRT-PCR with the hi primer set using the At4g26410 transcript as a normalization reference (Czechowski et al., 2005). The graph shows the average ± sd percentage of normalized B′′β transcript of mutant with respect to the wild type from four (b′′β-1) or three (OE-B′′β) independent culture and sample processing experiments. Asterisks indicate levels of statistical significance as determined for Student’s t test: *P < 2 10−3 for OE-B′′β versus wild-type Col-3; **P < 2 10−4 for b′′β-1 versus wild-type Ler. (D) Immunodetection of the HA-B′′β protein in OE-B′′β plants. A segregating population of OE-B′′β, a transgenic control OE-GUS and their parental wild-type line were analyzed by immunoblot with the anti-HA 3F10 monoclonal antibody. Samples correspond to total protein from supernatant fraction of 14-d-old seedlings. On the left, arrowheads indicate the position of epitope-tagged HA-B′′β and HA-GUS proteins corresponding to OE-B′′β and OE-GUS plants, respectively. (E) HMGR activity and transcript levels. Arabidopsis b′′α-1, b′′α-2, b′′α-3, b′′β-1, and OE-B′′β mutant seedlings, together with the corresponding wild-type controls (Col-7, Col-7, Col-0, Ler, and Col-3, respectively), were grown for 15 d under long-day conditions in MS medium. After collection and freezing, sample aliquots were taken for HMGR-specific activity and transcript level determination. HMG1 and HMG2 transcript levels were estimated by qRT-PCR using the GAPDH transcript for normalization, as previously described (Nieto et al., 2009). The graph represents the HMGR-specific activity (black) and the relative HMG1 (gray) and HMG2 (white) transcript levels as the average ratio ± sd between the mutants and the corresponding wild-type control from at least three independent culture and sample processing experiments. The HMGR-specific activity (pmol HMG-CoA/min*mg) was 8.62 ± 0.81 for wild-type Col-7, 9.78 ± 1.44 for wild-type Col-0, 16.55 ± 2.39 for wild-type Ler, and 8.38 ± 1.62 for wild-type Col-3. The asterisks indicate levels of statistical significance as determined for Student’s t test: *P < 0.02 for OE-B′′β versus wild-type Col-3; **P < 0.002 for b′′β-1 versus wild-type Ler.
Figure 6.
Figure 6.
Effect of NaCl on the Root Growth of PP2A Mutants. Mutant rcn1-1 (A), b′′α-1 (B), b′′α-2 (C), b′′α-3 (D), and b′′β-1 (E) Arabidopsis seedlings (dotted lines) grown for 4 d in half-concentrated MS were transferred, together with the corresponding wild-type (wt) control (black lines), to plates containing the same medium and the indicated concentrations of NaCl. After six additional days, the new growth of the main root was measured and expressed as the percentage with respect to the growth in the absence of NaCl. The graphs show the average and sd of three ([A] to [C] and [E]) or seven (D) independent experiments, with 10 plants per experimental condition. For clarity, only the positive (mutant) or negative (wild type) sd is shown. Asterisks indicate levels of statistical significance as determined by paired Student’s t test: *P < 0.05, **P < 0.005, and ***P < 0.0005 for the indicated mutant versus the corresponding wild-type line.
Figure 7.
Figure 7.
Temporal Profile of HMGR Activity in Seedlings Subjected to Salt Stress. Mutant and wild-type (wt) Arabidopsis seedlings were grown for 2 weeks under long-day conditions on polyester filters layered over half-concentrated MS. The filters were transferred to plates containing the same medium supplemented with 50 mM NaCl or 50 mM NaCl and 10 μM cantharidin (+canth) and growth was continued. Samples were collected and frozen at the indicated times. Cdev is a development control of nontransferred wild-type Col-0 plants. Ctransf is a control of wild-type Col-0 plants transferred to half-concentrated MS medium without NaCl. (A) and (D) to (F) Average percentage of HMGR-specific activity of the different genotypes (wild type, black lines; mutant, dotted lines) and treatments (+canth, gray line) with respect to the corresponding starting values. Calculations were made from at least three independent culture and sample processing experiments. For clarity, only the positive (wild type) or negative (mutant) sd is shown. The HMGR-specific activity (pmol HMG-CoA/min*mg) at day 0 was 9.78 ± 1.44 for wild-type Col-0, 15.02 ± 1.63 for wild-type Col-3, 13.23 ± 4.51 for b′′α-1, 11.63 ± 2.36 for b′′α-2, 9.32 ± 0.73 for b′′α-3, 16.55 ± 2.39 for wild-type Ler, and 25.52 ± 1.78 for b′′β-1. (B) qRT-PCR analysis of RAB18, RD29a, RD22, and KIN2 marker transcripts in wild-type Col-0 seedlings transferred to NaCl-containing plates using the At4g26410 transcript as a normalization reference. The graph shows the average percentage and sd of the relative transcript level with respect to the corresponding starting values in two independent assays. (C) Wild-type Col-0 and b′′α-3 plants were germinated and grown for 16 d on MS medium containing 4 μM lovastatin or 5 μM mevinolin and the indicated concentrations of NaCl; the graph represents the average and sd of seedling establishment percentage in four independent experiments, with 60 plants per experimental condition. (F) Asterisks indicate levels of statistical significance of mutant versus the wild type as determined by Student’s t test: **P < 10−12 for b′′α-1; *P < 10−4 for b′′α-2.
Figure 8.
Figure 8.
Temporal Profile of HMGR Transcript and Protein Levels in Seedlings Subjected to Salt Stress. HMGR transcript and protein levels were determined in the same samples used in Figure 7. HMG1 transcript levels were measured by qRT-PCR using the At4g26410 transcript as a normalization reference (Czechowski et al., 2005). HMGR protein level was estimated by quantification of the anti-CD1-i signal after immunoblot. The chemiluminescence HMGR band was normalized to the Coomassie blue–stained Rubisco band of the same immunoblot filter. (A) to (D) The graphs show the average percentage of HMGR protein level ([A] and [D]) and relative transcript level ([B] and [C]) of the different genotypes (wild type [wt], black lines; mutant, dotted lines) and treatments (+canth, gray line) with respect to the corresponding starting values. Calculations were made from at least three independent culture and sample processing experiments. For clarity, only the positive (wild type) or negative (mutant) sd is shown. (E) Representative chemiluminescence (top) and Coomassie blue–stained (bottom) electrophoretic patterns used in HMGR protein level determinations.

References

    1. Aukerman M.J., Hirschfeld M., Wester L., Weaver M., Clack T., Amasino R.M., Sharrock R.A. (1997). A deletion in the PHYD gene of the Arabidopsis Wassilewskija ecotype defines a role for phytochrome D in red/far-red light sensing. Plant Cell 9: 1317–1326 - PMC - PubMed
    1. Ausubel F.M., Brent R., Kingston R.E., Moore D.D., Seidman J.G., Smith J.A., Struhl K. (1987). Current Protocols in Molecular Biology. (New York: John Wiley and Sons; ).
    1. Bach T.J., Rogers D.H., Rudney H. (1986). Detergent-solubilization, purification, and characterization of membrane-bound 3-hydroxy-3-methylglutaryl-coenzyme A reductase from radish seedlings. Eur. J. Biochem. 154: 103–111 - PubMed
    1. Blakeslee J.J., Zhou H.W., Heath J.T., Skottke K.R., Barrios J.A.R., Liu S.Y., DeLong A. (2008). Specificity of RCN1-mediated protein phosphatase 2A regulation in meristem organization and stress response in roots. Plant Physiol. 146: 539–553 - PMC - PubMed
    1. Camilleri C., Azimzadeh J., Pastuglia M., Bellini C., Grandjean O., Bouchez D. (2002). The Arabidopsis TONNEAU2 gene encodes a putative novel protein phosphatase 2A regulatory subunit essential for the control of the cortical cytoskeleton. Plant Cell 14: 833–845 - PMC - PubMed

Publication types

MeSH terms