

Genome-wide association study identifies nidogen 1 (NID1) as a susceptibility locus to cutaneous nevi and melanoma risk
- PMID: 21478494
- PMCID: PMC3110001
- DOI: 10.1093/hmg/ddr154
Genome-wide association study identifies nidogen 1 (NID1) as a susceptibility locus to cutaneous nevi and melanoma risk
Abstract
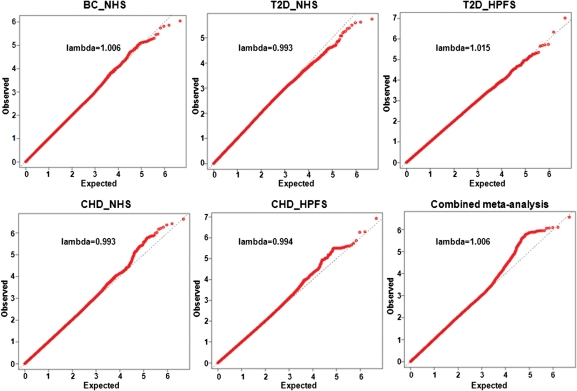
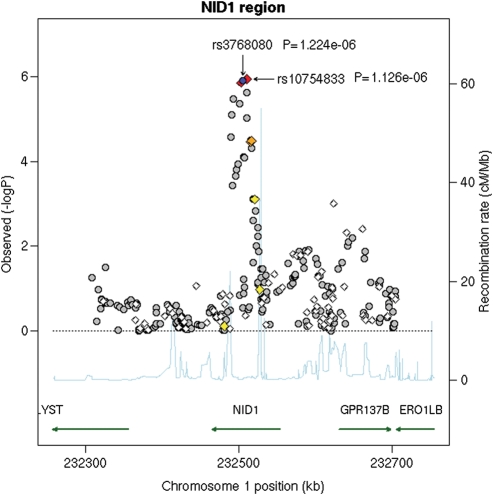
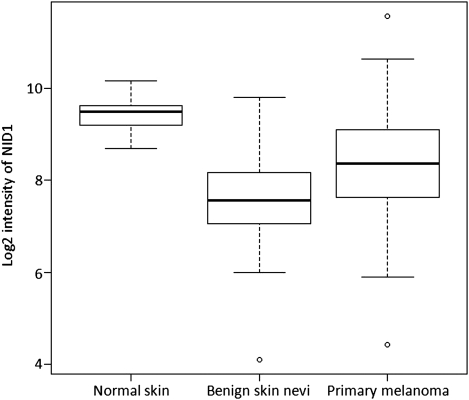
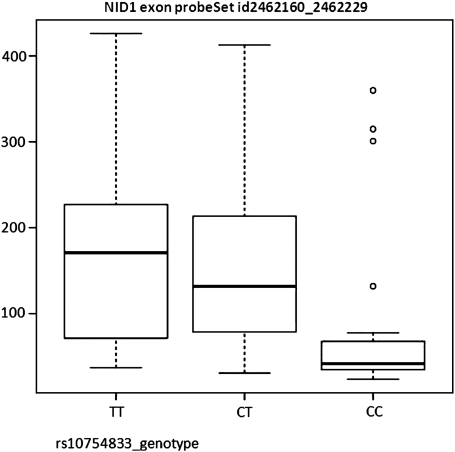
We conducted a genome-wide association study on the number of melanocytic nevi reported by 9136 individuals of European ancestry, with follow-up replication in 3581 individuals. We identified the nidogen 1 (NID1) gene on 1q42 associated with nevus count (two linked single nucleotide polymorphisms with r(2) > 0.9: rs3768080 A allele associated with reduced count, P = 6.5 × 10(-8); and rs10754833 T allele associated with reduced count, P = 1.5 × 10(-7)). We further determined that the rs10754833 [T] was associated with a decreased melanoma risk in 2368 melanoma cases and 7432 controls [for CT genotype: odds ratio (OR) = 0.86, 95% confidence interval (CI) = 0.75-0.99, P = 0.04; for TT genotype: OR = 0.84, 95% CI = 0.71-0.98, P = 0.03]. Expression level of the NID1 locus was 2-fold higher for the rs10754833 T allele carriers than that with the CC genotype (P = 0.017) in the 87 HapMap CEU cell lines. The NID1 gene is a biologically plausible locus for nevogenesis and melanoma development, with decreased expression levels of NID1 in benign nevi (P = 3.5 × 10(-6)) and in primary melanoma (P = 4.6 × 10(-4)) compared with the normal skin.
Figures
References
-
- Gandini S., Sera F., Cattaruzza M.S., Pasquini P., Abeni D., Boyle P., Melchi C.F. Meta-analysis of risk factors for cutaneous melanoma: I. Common and atypical naevi. Eur. J. Cancer. 2005;41:28–44. doi:10.1016/j.ejca.2004.10.015. - DOI - PubMed
-
- Whiteman D.C., Whiteman C.A., Green A.C. Childhood sun exposure as a risk factor for melanoma: a systematic review of epidemiologic studies. Cancer Causes Control. 2001;12:69–82. doi:10.1023/A:1008980919928. - DOI - PubMed
-
- Chin L. The genetics of malignant melanoma: lessons from mouse and man. Nat. Rev. Cancer. 2003;3:559–570. doi:10.1038/nrc1145. - DOI - PubMed
-
- Greene M.H., Clark W.H., Jr, Tucker M.A., Kraemer K.H., Elder D.E., Fraser M.C. High risk of malignant melanoma in melanoma-prone families with dysplastic nevi. Ann. Intern. Med. 1985;102:458–465. - PubMed
-
- Bataille V., Snieder H., MacGregor A.J., Sasieni P., Spector T.D. Genetics of risk factors for melanoma: an adult twin study of nevi and freckles. J. Natl Cancer Inst. 2000;92:457–463. doi:10.1093/jnci/92.6.457. - DOI - PubMed
Publication types
MeSH terms
Substances
Grants and funding
- CA093459/CA/NCI NIH HHS/United States
- P01 CA055075/CA/NCI NIH HHS/United States
- CA87969/CA/NCI NIH HHS/United States
- CA49449/CA/NCI NIH HHS/United States
- R01 CA122838/CA/NCI NIH HHS/United States
- U01 CA049449/CA/NCI NIH HHS/United States
- P50 CA093459/CA/NCI NIH HHS/United States
- CA100264/CA/NCI NIH HHS/United States
- P01 CA087969/CA/NCI NIH HHS/United States
- R01 CA049449/CA/NCI NIH HHS/United States
- CA055075/CA/NCI NIH HHS/United States
- R01 CA100264/CA/NCI NIH HHS/United States
- CA122838/CA/NCI NIH HHS/United States
LinkOut - more resources
Full Text Sources
Medical
Miscellaneous
