. 2011 May;18(5):604-13.
doi: 10.1038/nsmb.2021. Epub 2011 Apr 10.

Structural basis for antigenic peptide precursor processing by the endoplasmic reticulum aminopeptidase ERAP1

Affiliations

Structural basis for antigenic peptide precursor processing by the endoplasmic reticulum aminopeptidase ERAP1

Tina T Nguyen et al. Nat Struct Mol Biol. 2011 May.

Abstract

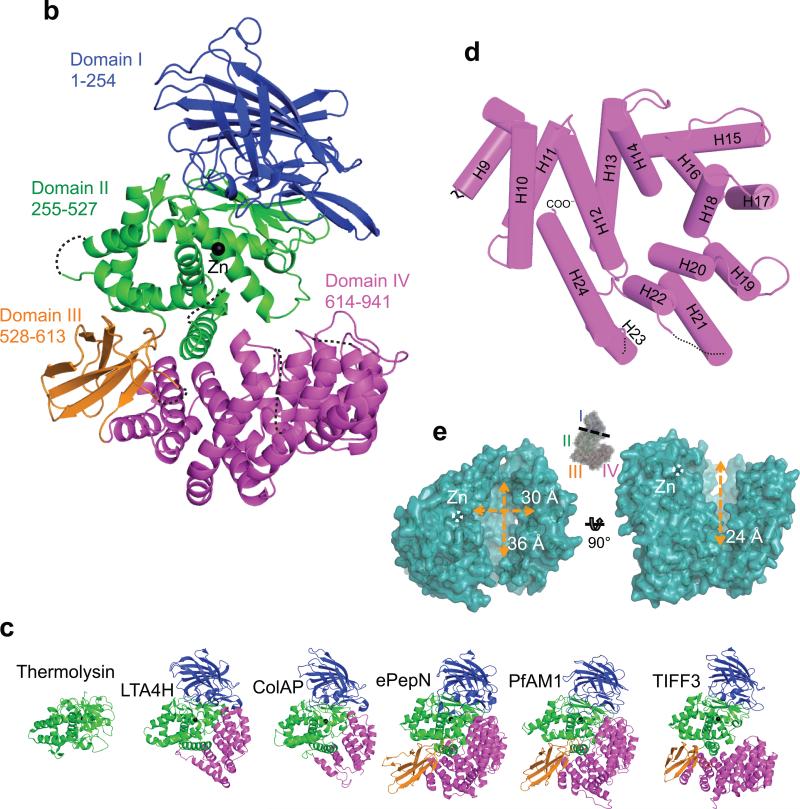
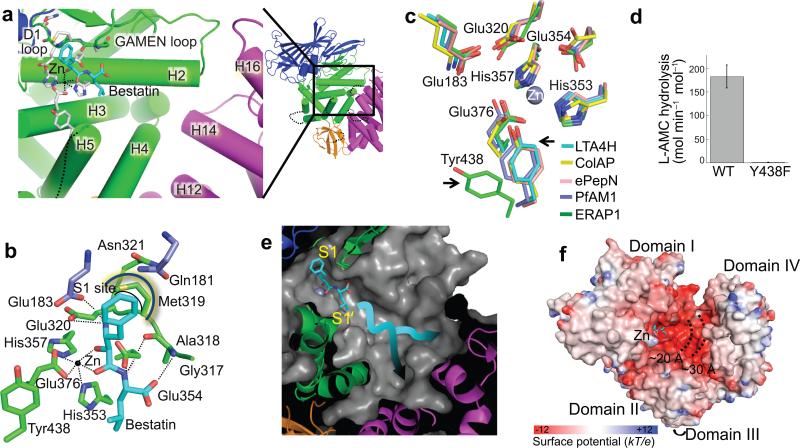
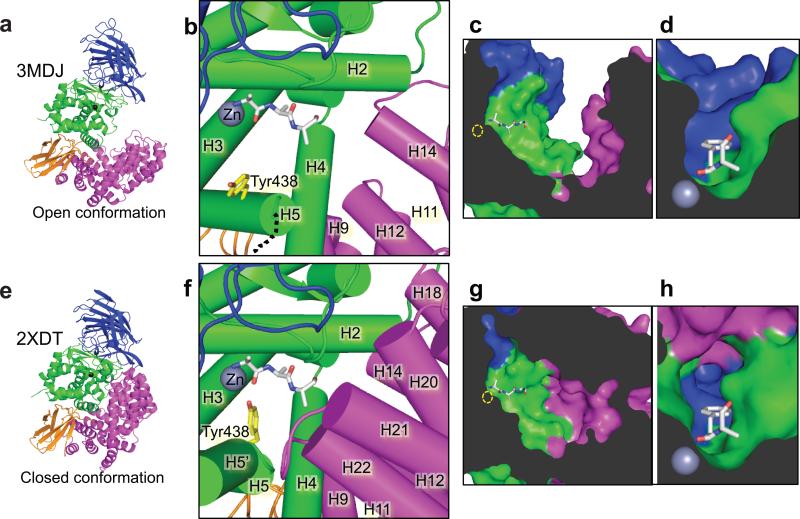
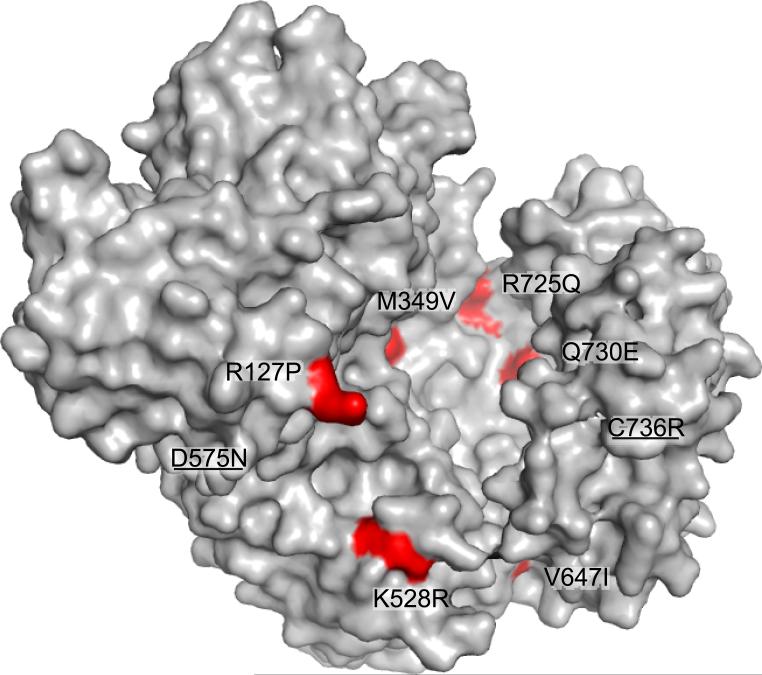
ERAP1 trims antigen precursors to fit into MHC class I proteins. To fulfill this function, ERAP1 has unique substrate preferences, trimming long peptides but sparing shorter ones. To identify the structural basis for ERAP1's unusual properties, we determined the X-ray crystal structure of human ERAP1 bound to bestatin. The structure reveals an open conformation with a large interior compartment. An extended groove originating from the enzyme's catalytic center can accommodate long peptides and has features that explain ERAP1's broad specificity for antigenic peptide precursors. Structural and biochemical analyses suggest a mechanism for ERAP1's length-dependent trimming activity, whereby binding of long rather than short substrates induces a conformational change with reorientation of a key catalytic residue toward the active site. ERAP1's unique structural elements suggest how a generic aminopeptidase structure has been adapted for the specialized function of trimming antigenic precursors.


Figures

Figure 1
Figure 1
ERAP1 structure and domain arrangement. (a) Structure based alignment of ERAP1 with M1 aminopeptidase family members human leukotriene A4 hydrolase (LTA4H), T. acidophilium tricorn interacting factor F3 (TIFF3), E. coli aminopeptidase N (ePepN), P. falciparum aminopeptidase M1 (PfAM1), and C. psychrerythraea cold active aminopeptidase (ColAP). Numbering corresponds to human ERAP1, colored lines indicate domains in ERAP1; coils and strands represent helices and strands respectively, and dashes represent loops not observed in crystal structure. Asterisk marked residues are homologous among the shown aminopeptidases; boxed residues are highly conserved M1 aminopeptidase motifs HExxEx18E, GAMEN, and Tyr438. Positions of disulfide bonds are indicated and observed glycosylation sites are marked by balloon icons. (b) Overall shape of ERAP1 represented as a ribbon diagram and colored according to domains: blue is domain I, green is domain II, orange is domain III, and pink is domain IV. Dotted lines represent disordered loops. (c) Structures of M1 aminopeptidases family members and thermolysin, colored by domain: B. thermoproteolyticus thermolysin (PDB 3FV4), LTA4H (PDB 3FUH), ColAP (PDB 3CIA), ePepN (PDB 2HPT), PfAM1 (PDB 3EBG), and TIFF3 (PDB 1Z5H). (d) Schematic diagram of C-terminal domain of ERAP1 with helices represented as cylinders showing the ARM/HEAT motif spiral forming a large cavity lined by the even numbered helices. (e) Large cavity formed by the catalytic domain and C-terminal domain shown in a surface representation. Inset shows how the N-terminal domain was removed above the dashed black line to provide a clear view of the cavity. Orange dashed lines represent estimated distances across the cavity.
Figure 1
Figure 1
ERAP1 structure and domain arrangement. (a) Structure based alignment of ERAP1 with M1 aminopeptidase family members human leukotriene A4 hydrolase (LTA4H), T. acidophilium tricorn interacting factor F3 (TIFF3), E. coli aminopeptidase N (ePepN), P. falciparum aminopeptidase M1 (PfAM1), and C. psychrerythraea cold active aminopeptidase (ColAP). Numbering corresponds to human ERAP1, colored lines indicate domains in ERAP1; coils and strands represent helices and strands respectively, and dashes represent loops not observed in crystal structure. Asterisk marked residues are homologous among the shown aminopeptidases; boxed residues are highly conserved M1 aminopeptidase motifs HExxEx18E, GAMEN, and Tyr438. Positions of disulfide bonds are indicated and observed glycosylation sites are marked by balloon icons. (b) Overall shape of ERAP1 represented as a ribbon diagram and colored according to domains: blue is domain I, green is domain II, orange is domain III, and pink is domain IV. Dotted lines represent disordered loops. (c) Structures of M1 aminopeptidases family members and thermolysin, colored by domain: B. thermoproteolyticus thermolysin (PDB 3FV4), LTA4H (PDB 3FUH), ColAP (PDB 3CIA), ePepN (PDB 2HPT), PfAM1 (PDB 3EBG), and TIFF3 (PDB 1Z5H). (d) Schematic diagram of C-terminal domain of ERAP1 with helices represented as cylinders showing the ARM/HEAT motif spiral forming a large cavity lined by the even numbered helices. (e) Large cavity formed by the catalytic domain and C-terminal domain shown in a surface representation. Inset shows how the N-terminal domain was removed above the dashed black line to provide a clear view of the cavity. Orange dashed lines represent estimated distances across the cavity.
Figure 2
Figure 2
ERAP1 active site. (a) Structural elements forming the ERAP1 active site. Loops and helices, shown as cylinders, are colored as in Fig. 1b. Bestatin is shown with cyan bonds, zinc as a black sphere. ERAP1 residues in the active site are shown with white bonds. Inset at right shows the entire protein for orientation; in the view shown helices 19 and 21 that occlude the active site were removed for clarity. (b) ERAP1 interactions with bound aminopeptidase inhibitor bestatin. Side chains of conserved catalytic residues of ERAP1 are shown carbon atoms colored by domain. Black arc indicates S1 site. (c) Conservation of catalytic residues among M1 family aminopeptidase structures, shown as an overlay of the active sites of LTA4H (cyan), COLAP (yellow), ePepN (pink), PfAM1 (purple), and ERAP1 (green). ERAP1 has an altered orientation of Tyr438 relative to the other aminopeptidases (arrows). Residue numbers correspond to ERAP1. (d) ERAP1 enzymatic activity is dependent on the side-chain hydroxyl of Tyr438. L-AMC hydrolysis activity of wild-type and Y438F ERAP1. Error bars show standard deviation of 3 measurements. (e) The substrate binding cavity extends from the active site into domain IV. Surface representation of ERAP1 near the active site, with the catalytic zinc shown as a dark gray sphere, and bestatin with cyan bonds. Expected positions of peptide side chain binding pockets S1 and S1′ indicated. Arrows represent possible paths of peptides extending from the active site into the cavity. (f) Electrostatic surface map of ERAP1. Surface colored from red to blue representing negatively charged to positively charged regions. Dotted lines represent indicated distances from zinc ion (grey sphere). Bestatin colored with cyan bonds.
Figure 3
Figure 3
Open and closed conformations of ERAP1. (a–d) ERAP1-bestatin in an open conformation as reported here (PDB 2MDJ). (e–h) ERAP1 in closed conformation as reported in a recent crystal structure (PDB 2XDT). (a,e) Ribbon diagrams, aligned as in Figure 1c, showing domain reorientation. (b,f) View of active site, with zinc atom shown in gray, model tri peptide substrate with white bonds, and Tyr438 with yellow bonds. ERAP1 helices shown as cylinders and colored according to domain. Motion of helices H18–H22, reorientation of H5, and folding of an additional region H5′ N-terminal to H5 are apparent in the closed conformation. (c,g) Cutaway view of peptide binding cavity, with surface of cavity colored according to domain, model peptide substrate with white bonds, and position of zinc atom outlined in yellow. Although the cavity is isolated from solvent in the closed conformation, its length is not substantially changed. (d,h) Closeup view of S1 site, looking from the cavity toward towards the S1 site. A phenylalanine side chain has been modeled at the P1 position.
Figure 4
Figure 4
Length dependent peptide cleavage and allosteric activation by ERAP1. (a) ERAP1 processing of a series of truncated and extended SIINFEKL variants. (b) ERAP1 processing of a series of LGnL peptides. (c) Activation of L-AMC hydrolysis by the same SIINFEKL length variants as in (a). L-AMC hydrolysis in the absence of added peptide is indicated by the open bar and the dotted line. (d) Activation of L-AMC hydrolysis by LGnL peptides. (e) ERAP1 processing of LGnL peptides as in panel c, but in the presence of 50 μM INFEKL peptide. The change in processing by ERAP1 is the ratio of processing with the presence of INFEKL over the processing by ERAP1 without INFEKL. Standard deviations are indicated by error bars.
Figure 5
Figure 5
Kinetic analysis. (a) Initial rate of removal of the amino-terminal residue of an internally quenched WRVYEKCdnpALK peptide, as a function of peptide concentration. Solid line shows best fit to an equation describing simple Michealis-Menten behavior with Km = 14.8 ± 1.7 μM and Vmax = 62.3 ± 2.9 μmol min–1 nmol–1. (b) Initial rate of hydrolysis of the fluorogenic L-AMC substrate as a function of concentration. Lines show best fit to simple Michaelis-Menten (dashed line) and allosteric activation (solid line) equations, which include a correction for inner filter effects and reduced apparent activity at high concentrations (see Methods for details). (c) Initial rate of hydrolysis of colorimetric L-pNA substrate as a function of concentration shows sigmoidal kinetics behavior. Lines show best fit to simple Michaelis-Menten (dashed line) and allosteric activation (solid line) equations. (d) Dynamic light scattering analysis of ERAP1 in PBS. Hydrodynamic radius estimated for a 105 kDa protein using a spherical model is 4.35 nm. (e) Gel filtration analysis shows enzymatically active monomeric population. Top. Elution profile for ERAP1 in PBS followed using absorbance at 280 nm, with elution position of molecular weight standards shown above plot. Bottom. Fractions were tested for L-AMC hydrolysis as a measurement of ERAP1 activity. (f) L-AMC hydrolysis is linearly dependent on ERAP1 concentration. Standard deviations are indicated by error bars.
Figure 6
Figure 6
Non-hydrolyzable peptide activates L-AMC hydrolysis but inhibits full-length peptide hydrolysis. (a) An optimized ERAP1 substrate, peptide L (LVAFKARAF), is processed efficiently by ERAP1. Reverse-phase chromatograms of peptides incubated in the presence or absence of ERAP1 are shown. Arrow indicates processed product VAFKARAF. (b) N-methylation of the first amide bond in LMe peptide prevents degradation by ERAP1. (c) ERAP1 hydrolysis of L-AMC is activated by increasing concentrations of peptide L. Line shows fit to an equation describing simple hyperbolic activation. (d) ERAP1 hydrolysis of L-AMC is activated by increasing concentrations of LMe, fit as in panel c. (e) Concentration dependence of initial rate of L-AMC hydrolysis by ERAP1 in the absence (filled black symbols) or presence (open red symbols) of 50 μM LMe. Lines show fits to allosteric activation equation as in Fig. 5b. (f) ERAP1 hydrolysis of a fluorescent peptide substrate is inhibited by increasing concentrations of LMe. Line shows fit to a competitive binding equation. Standard deviations are indicated by error bars.
Figure 7
Figure 7
Model for ERAP1 length dependent cleavage activity. (a) A short peptide (5-mer shown) cannot reach from the catalytic site to the regulatory site. ERAP1 remains in the lower-activity open conformation and the peptide is processed inefficiently. (b) A long peptide (9-mer shown) can reach the regulatory site. ERAP1 adopts the higher-activity closed conformation and the peptide is processed efficiently. (c) A small fluorogenic substrate (L-AMC shown) cannot reach from the catalytic site to the regulatory site and is processed inefficiently. (d) A peptide (7-mer shown) can bind to the regulatory site together with a smaller substrate (L-AMC shown), leading to conversion to the closed conformation and increased aminopeptidase activity.
Figure 8
Figure 8
Ankylosing spondylitis-associated mutations mapped on surface of ERAP1 Surface of ERAP1 in gray, with polymorphisms associated with ankylosing spondylitis shown in red. Underlined residues are hidden in this view.

References

    1. Rock KL, York IA, Goldberg AL. Post-proteasomal antigen processing for major histocompatibility complex class I presentation. Nat Immunol. 2004;5:670–7. - PubMed
    1. Fruci D, Niedermann G, Butler RH, van Endert PM. Efficient MHC class I-independent amino-terminal trimming of epitope precursor peptides in the endoplasmic reticulum. Immunity. 2001;15:467–76. - PubMed
    1. Serwold T, Gaw S, Shastri N. ER aminopeptidases generate a unique pool of peptides for MHC class I molecules. Nat Immunol. 2001;2:644–51. - PubMed
    1. Saric T, et al. An IFN-gamma-induced aminopeptidase in the ER, ERAP1, trims precursors to MHC class I-presented peptides. Nat Immunol. 2002;3:1169–76. - PubMed
    1. Serwold T, Gonzalez F, Kim J, Jacob R, Shastri N. ERAAP customizes peptides for MHC class I molecules in the endoplasmic reticulum. Nature. 2002;419:480–3. - PubMed

Publication types

Associated data