. 2011 May 5;473(7345):87-91.
doi: 10.1038/nature09880. Epub 2011 Apr 10.

Functional specificity of local synaptic connections in neocortical networks

Affiliations

Functional specificity of local synaptic connections in neocortical networks

Ho Ko et al. Nature. .

Abstract

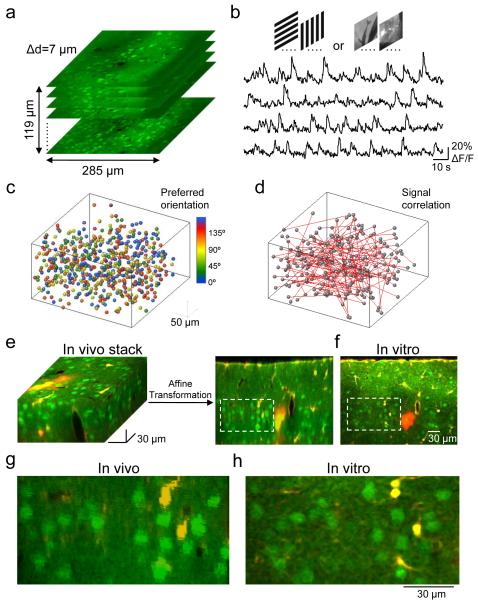
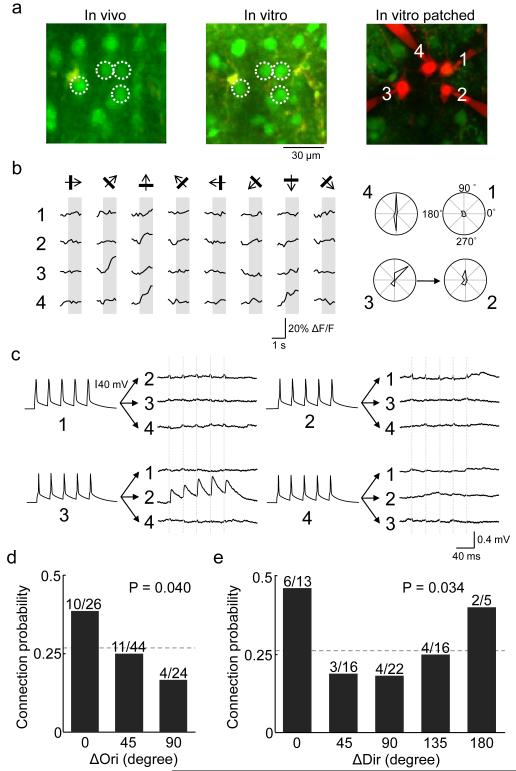
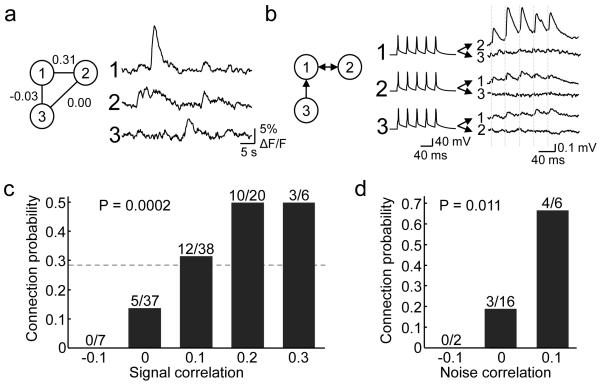
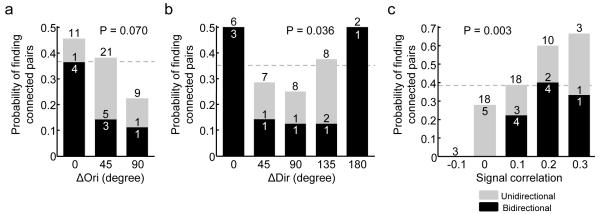
Neuronal connectivity is fundamental to information processing in the brain. Therefore, understanding the mechanisms of sensory processing requires uncovering how connection patterns between neurons relate to their function. On a coarse scale, long-range projections can preferentially link cortical regions with similar responses to sensory stimuli. But on the local scale, where dendrites and axons overlap substantially, the functional specificity of connections remains unknown. Here we determine synaptic connectivity between nearby layer 2/3 pyramidal neurons in vitro, the response properties of which were first characterized in mouse visual cortex in vivo. We found that connection probability was related to the similarity of visually driven neuronal activity. Neurons with the same preference for oriented stimuli connected at twice the rate of neurons with orthogonal orientation preferences. Neurons responding similarly to naturalistic stimuli formed connections at much higher rates than those with uncorrelated responses. Bidirectional synaptic connections were found more frequently between neuronal pairs with strongly correlated visual responses. Our results reveal the degree of functional specificity of local synaptic connections in the visual cortex, and point to the existence of fine-scale subnetworks dedicated to processing related sensory information.


Figures

Figure 1
Figure 1. Imaging functional properties of neurons in vivo and indentifying the same neurons in vitro
a, Two-photon imaging was used to sample somatic calcium signals from a complete population of L2/3 neurons within a 285×285×119 μm3 volume. Imaging was carried out at 7 μm depth increments. Neurons were labeled with the calcium indicator dye OGB-1 AM (green) and the astrocyte marker SR101 (red). b, Example traces of calcium signals from four different cells in the imaged volume while presenting six trials of grating stimuli drifting in eight different directions. c, All orientation selective cells in the volume were color-coded according to preferred orientation and plotted as spheres. d, Signal correlations were computed from average responses to natural movies. Red lines represent strongly correlated neuronal pairs (signal correlation > 0.2). e and f, After imaging visually evoked calcium signals, a detailed image stack was obtained in vivo. The brain was sliced coronally and another stack of the same tissue was obtained in vitro (a single optical plane is shown in f). Affine transformation was used to align the in vivo to the in vitro stack, allowing precise matching of OGB-1-filled cells in the two stacks. g and h, Close-ups of the regions outlined with dashed lines in e and f, respectively.
Figure 2
Figure 2. Relating orientation and direction preference to connection probability among L2/3 pyramidal neurons
a White circles denote the locations of in vivo to in vitro matched cells that were targeted for whole-cell recording and filled with Alexa 594. b. Left: average calcium responses of the four cells to oriented drifting gratings. Right: corresponding polar plots of inferred spike rate responses, normalized to the maximum response of cell 4. Three of the cells (cells 2, 3 and 4) were reliably responsive and orientation selective. Arrow shows a connection detected from cell 3 to cell 2. c, Membrane potential recordings from the four cells. Currents were injected into each cell in sequence, and from average traces of postsynaptic potentials an excitatory connection was found from cell 3 to cell 2. No other connections were found. Vertical dashed lines indicate timing of presynaptic spikes. In some traces, stimulation artefacts are visible that coincided exactly with presynaptic spikes and therefore could be clearly distinguished from EPSPs. d, Relationship between connection probability and difference in preferred orientation (ΔOri) among pairs in which both neurons were responsive to grating stimuli and were orientation selective (OSI > 0.4). There was a significant decreasing trend in connection probability as ΔOri increased (P = 0.040, Cochran-Armitage test). Dotted line indicates connection probability for all pairs included in this analysis (25/94, 0.27). The bins include difference in orientation values of 0 to 22.5° (zero degree bin), 22.5° to 67.5° (45 degree bin), and 67.5° to 90° (90 degree bin). e, Relationship between connection probability and difference in preferred direction (ΔDir) in the subset of neurons which were direction-selective (DSI > 0.3). The same decreasing trend with respect to ΔOri was detected (P = 0.034, Cochran-Armitage test). Neurons connected with specificity to preferred orientation but not to preferred direction. Dotted line indicates connection probability for all directionally selective pairs (19/72, 0.26). The bins include difference in orientation values of 0 to 22.5° (zero degree bin), 22.5° to 67.5° (45 degree bin), and so on.
Figure 3
Figure 3. Relationship between response correlation to natural movies and connection probability
a, An example of a triplet of neurons targeted for whole cell recording in vitro, with associated in vivo calcium responses to the natural movie (average of 6 repetitions) and spike rate correlation values. Neuron 1 and 2 showed correlated firing (signal correlation = 0.31), whereas other pairs did not. b, Triple recordings from the same neurons reveals the pattern of connections: neurons 1 and 2 were bidirectionally connected, while neuron 3 provided input to neuron 1. Dashed lines indicate timing of presynaptic spikes. c, There was a significant increase in connection probability with increasing signal correlation to natural movies (P = 0.0002, Cochran-Armitage test). Dotted line indicates connection probability for all pairs included in this analysis (30/108, 0.28). d, Connection probability increased significantly with increase in noise correlation (P = 0.011, Cochran-Armitage test). Correlation values were binned, with ranges from −0.15 to −0.05, from −0.05 to 0.05, and so on.
Figure 4
Figure 4. Relationship between similarity of visual responses and probability of finding unidirectionally and bidirectionally connected pairs
a, Among orientation selective neurons, probability of finding connected pairs decreased as ΔOri increased. The fall-off in probability of finding bidirectionally connected pairs was steeper than the decrease in overall probability of finding connected pairs. A trend of decrease in probability of finding bidirectionally connected pairs was found (P = 0.070, Cochran-Armitage test). b, The same observation holds in the subset of directionally selective pairs, and probability of finding bidirectionally connected pairs decreased as ΔOri increased (P = 0.036, Cochran-Armitage test). c, The probability of finding bidirectionally connected pairs increased sharply as signal correlation to natural movies increased (P = 0.003, Cochran-Armitage test). Dotted lines indicate probability of finding connected pairs from all pairs included in analysis (panel a: 15/41, 0.37; panel b: 11/31, 0.35; panel c: 20/52, 0.38).

Comment in

References

References Methods

    1. Smith SL, Trachtenberg JT. Experience-dependent binocular competition in the visual cortex begins at eye opening. Nat. Neurosci. 2007;10:370–375. - PubMed
    1. Rochefort NL, et al. Sparsification of neuronal activity in the visual cortex at eye-opening. Proc. Natl. Acad. Sci. U.S.A. 2009;106:15049–15054. - PMC - PubMed
    1. Brainard DH. The Psychophysics Toolbox. Spat Vis. 1997;10:433–436. - PubMed
    1. Pelli DG. The VideoToolbox software for visual psychophysics: transforming numbers into movies. Spat Vis. 1997;10:437–442. - PubMed
    1. Vogelstein JT, et al. Fast non-negative deconvolution for spike train inference from population calcium imaging. J Neurophysiol. 2010 doi:10.1152/jn.01073.2009. - PMC - PubMed

References

    1. Bosking WH, Zhang Y, Schofield B, Fitzpatrick D. Orientation selectivity and the arrangement of horizontal connections in tree shrew striate cortex. J. Neurosci. 1997;17:2112–2127. - PMC - PubMed
    1. Gilbert CD, Wiesel TN. Columnar specificity of intrinsic horizontal and corticocortical connections in cat visual cortex. J. Neurosci. 1989;9:2432–2442. - PMC - PubMed
    1. Roerig B, Kao JP. Organization of intracortical circuits in relation to direction preference maps in ferret visual cortex. J. Neurosci. 1999;19:RC44. - PMC - PubMed
    1. Weliky M, Kandler K, Fitzpatrick D, Katz LC. Patterns of excitation and inhibition evoked by horizontal connections in visual cortex share a common relationship to orientation columns. Neuron. 1995;15:541–552. - PubMed
    1. Song S, Sjöström PJ, Reigl M, Nelson S, Chklovskii DB. Highly nonrandom features of synaptic connectivity in local cortical circuits. PLoS Biol. 2005;3:e68. - PMC - PubMed

Publication types