. 2011 May;14(5):587-94.
doi: 10.1038/nn.2799. Epub 2011 Apr 10.

Structural basis for the role of inhibition in facilitating adult brain plasticity

Affiliations

Structural basis for the role of inhibition in facilitating adult brain plasticity

Jerry L Chen et al. Nat Neurosci. 2011 May.

Abstract

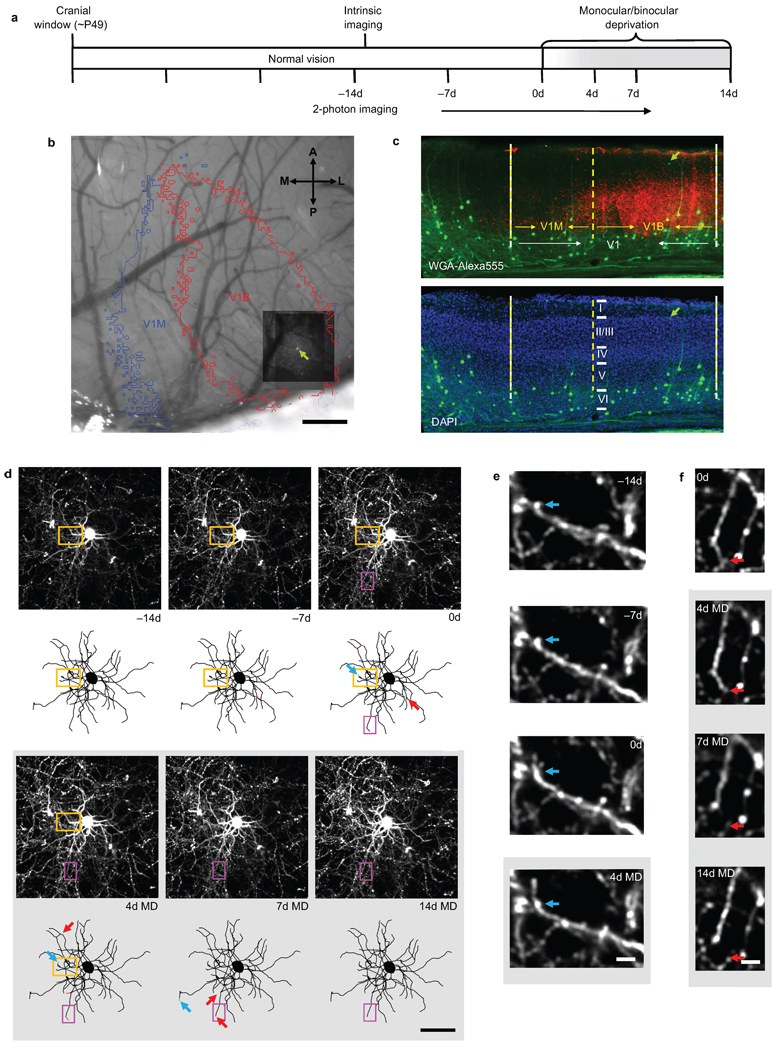
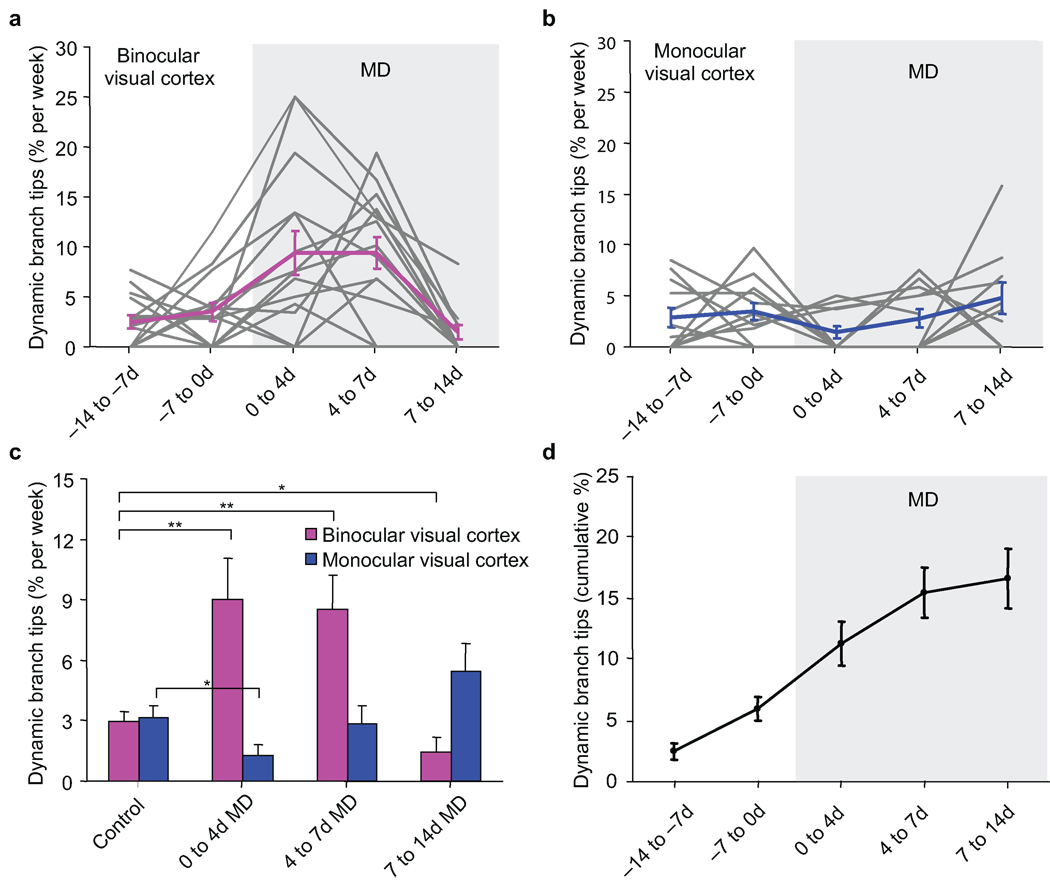
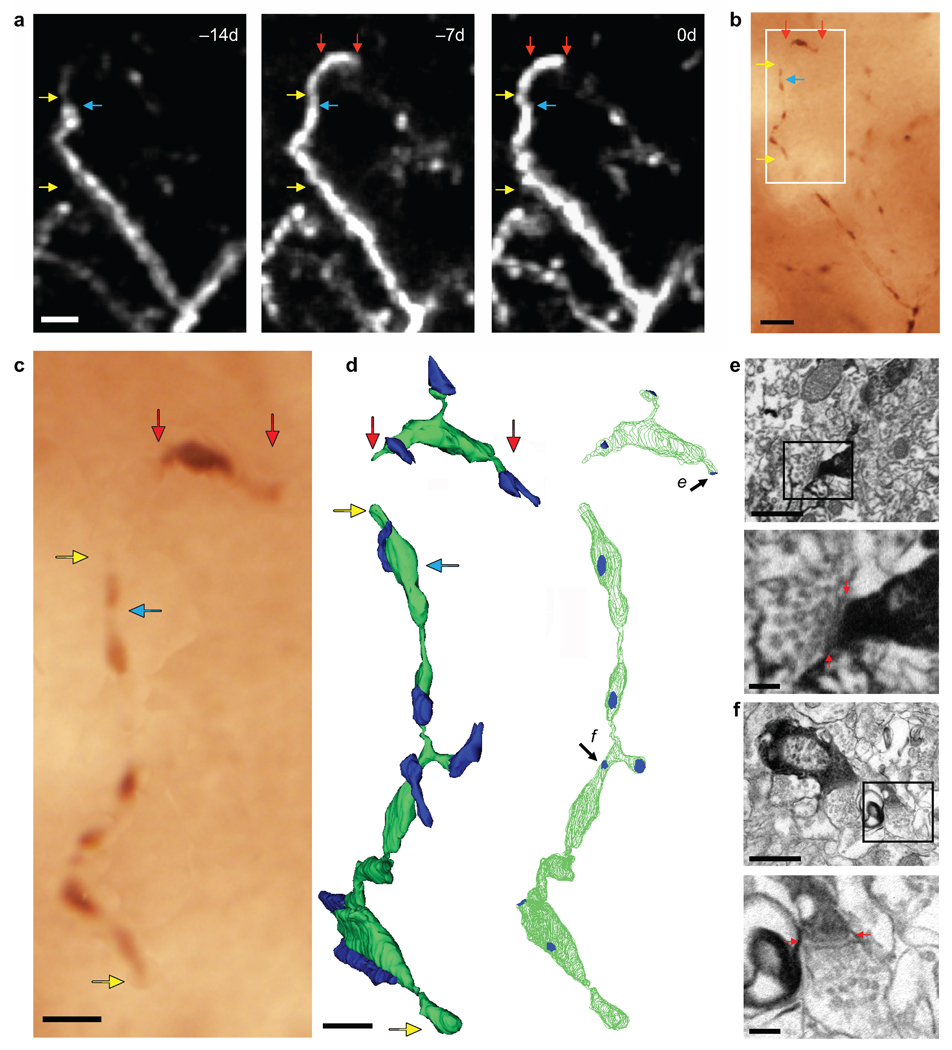
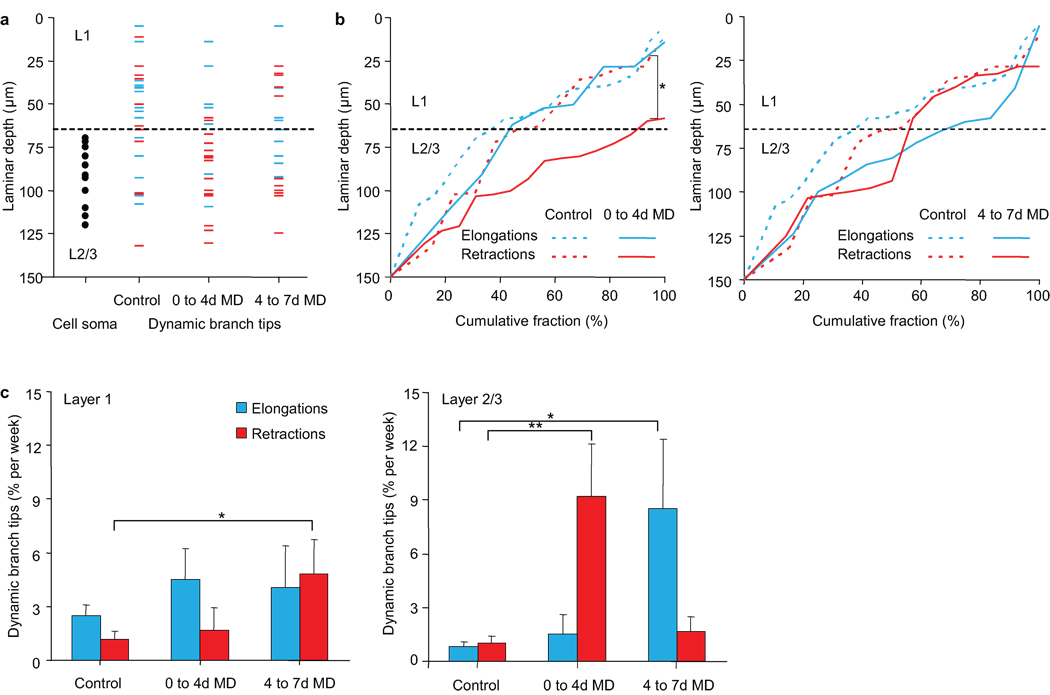
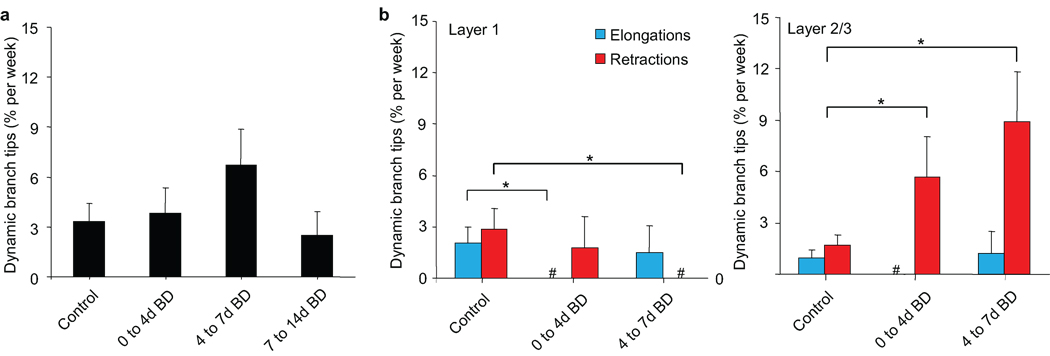
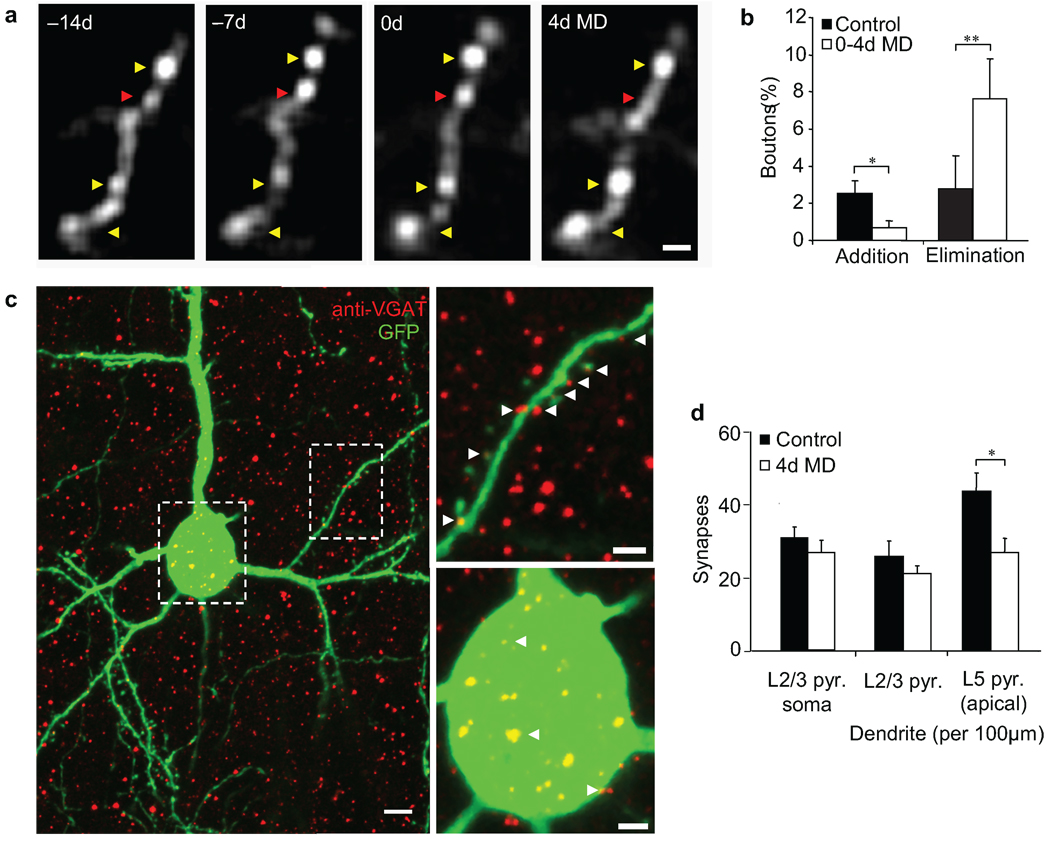
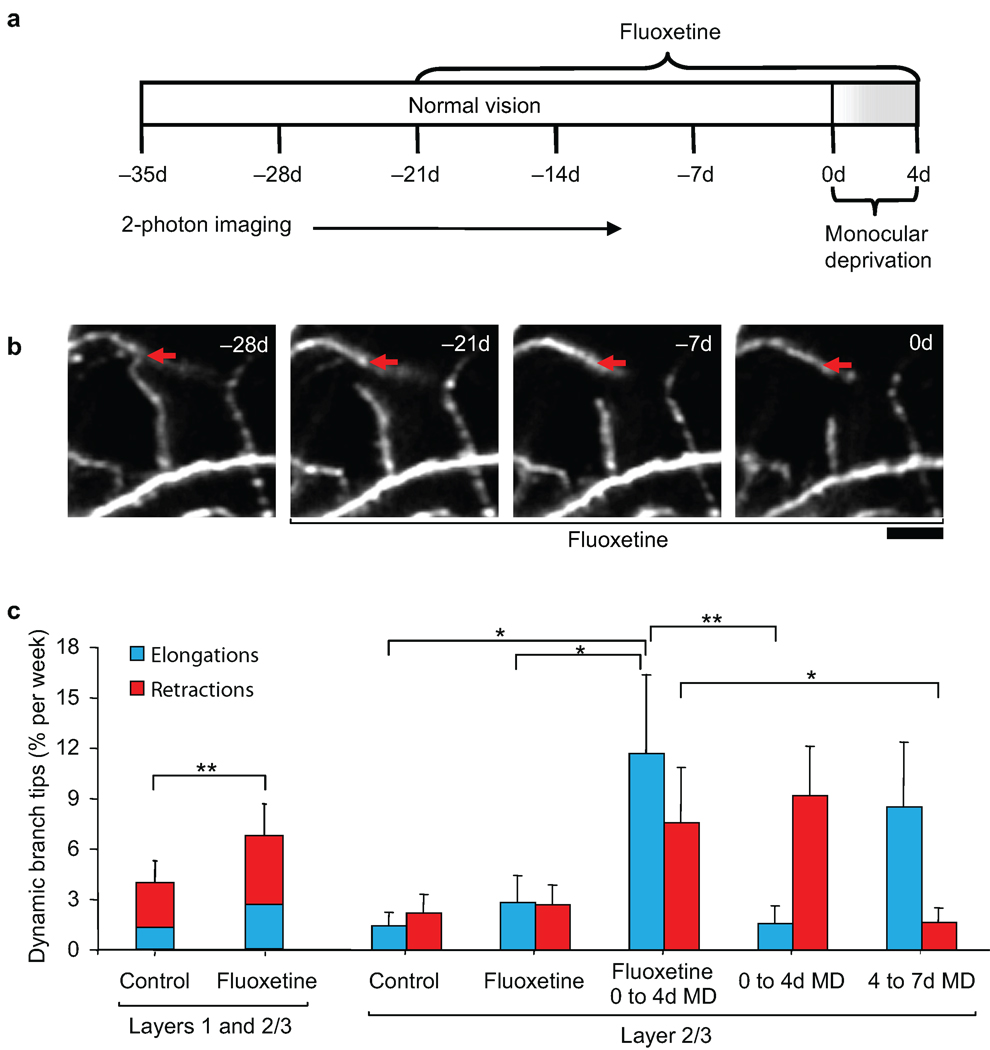
Although inhibition has been implicated in mediating plasticity in the adult brain, the underlying mechanism remains unclear. Here we present a structural mechanism for the role of inhibition in experience-dependent plasticity. Using chronic in vivo two-photon microscopy in the mouse neocortex, we show that experience drives structural remodeling of superficial layer 2/3 interneurons in an input- and circuit-specific manner, with up to 16% of branch tips undergoing remodeling. Visual deprivation initially induces dendritic branch retractions, and this is accompanied by a loss of inhibitory inputs onto neighboring pyramidal cells. The resulting decrease in inhibitory tone, also achievable pharmacologically using the antidepressant fluoxetine, provides a permissive environment for further structural adaptation, including addition of new synapse-bearing branch tips. Our findings suggest that therapeutic approaches that reduce inhibition, when combined with an instructive stimulus, could facilitate restructuring of mature circuits impaired by damage or disease, improving function and perhaps enhancing cognitive abilities.


Figures

Figure 1
Figure 1
Chronic two-photon in vivo imaging of dendritic branch tip dynamics in superficial L2/3 cortical interneurons. (a) Experimental time course. Every cell was imaged at all time points. (b) Maximum z-projection (MZP) of chronically imaged interneuron (green arrow) superimposed over intrinsic signal map of monocular (V1M) and binocular (V1B) visual cortex. (c) Coronal section of primary visual cortex (V1) containing an imaged superficial L2/3 interneuron (~70 µm below the pial surface) (green arrow) shown with respect to V1M and V1B as identified through WGA-Alexa555 labeling of thalamacortical projections from the ipsilateral eye (red) and DAPI staining of the granule cell layer (blue). (d) MZPs near the cell body (above) along with two-dimensional projections of three-dimensional skeletal reconstructions (below) of a superficial L2/3 interneuron (~85 µm below the pial surface) in V1B acquired at the specified intervals. Dendritic branch tip elongations and retractions identified between successive imaging sessions are indicated by green and red arrows, respectively. (e) High-magnification view of one branch tip elongation (orange box in [d]). Blue arrow marks the approximate distal end of the branch tip at −14d. (f) High-magnification view of one branch tip retraction (magenta box in [d]). Red arrow marks the approximate distal end of the branch tip at 0d. Scale bars: (b), 250 µm; (c), 100 µm; (d), 50 µm; (e,f), 5 µm.
Figure 2
Figure 2
Monocular deprivation increases interneuron dendritic branch tip dynamics in adult binocular visual cortex. (a,b) Dendritic branch tip dynamics in superficial L2/3 interneurons imaged throughout a 14 day monocular deprivation for: (a) binocular visual cortex, individual cells shown in grey, mean shown in magenta. (n = 16 cells from 13 mice, 524 branch tips) and; (b) monocular visual cortex, individual cells shown in grey, mean shown in blue. (n = 12 cells from 12 mice, 461 branch tips). (c) Rate of dendritic branch tip dynamics compared before and during monocular deprivation in binocular (magenta) and monocular (blue) visual cortex. (d) Cumulative fraction of dynamic branch tips in binocular visual cortex over imaging time course. (** p < 0.01, * p < 0.05). Error bars, s.e.m.
Figure 3
Figure 3
Synapses are formed on newly extended branch tips. (a) In vivo image of a branch tip elongation. Blue arrow marks the approximate distal end of the branch tip at −14d. (b) Re-identification of the same imaged dendrite in fixed tissue following immuno-staining for GFP. (c) High-magnification view of dendritic portion reconstructed by serial section electron microscopy (white box in [b]). (d) Serial section electron microscopy reconstruction of the in vivo imaged dendrite (in green) with region proximal to (yellow arrows in a-c) and very distal portion of (red arrows in a-c) elongated branch tip. Left panel indicates contacting axon terminals (in blue). Right panel indicates synaptic contacts (in blue). (e, f) Electron micrographs showing a synapse on the newly elongated branch tip (e arrow in [d]) and on the proximal, stable dendrite (f arrow in [d]), respectively. Bottom panels show an enlargement of the synapse with visible synaptic cleft (red arrows) and synaptic vesicles. Scale bars: (a,b), 5 µm; (c), 2µm; (d), 1 µm; (e,f – top panels), 500 nm; (e,f – bottom panels), 100 nm.
Figure 4
Figure 4
Monocular deprivation induces laminar specific dendritic arbor rearrangements. (a) Distribution of dynamic branch tips before and during monocular deprivation in binocular visual cortex. Plotted are cell soma positions (black circles) and branch tips positions of branch tip elongations (blue) or retractions (red). (b) Cumulative fraction distribution plot of branch tip elongations (blue) and retractions (red) at 0–4d MD (left) and 4–7d MD (right) as compared to control (dotted lines) (* p <0.05). (c) Rate of dendritic branch tip elongations (blue) and retractions (red) in L1 and L2/3 of binocular visual cortex, before and during monocular deprivation. (n = 16 cells from 13 mice, L1: 228 branch tips. L2/3: 325 branch tips) (** p < 0.01, *p < 0.05). Error bars, s.e.m.
Figure 5
Figure 5
Binocular deprivation specifically increases retractions of L2/3 branch tips. (a) Dendritic branch tip dynamics compared before and during binocular deprivation in binocular visual cortex. (b) Rate of branch tip elongations (blue) and retractions (red) in L1 and L2/3 of binocular visual cortex, before and during binocular deprivation. (n = 7 cells from 7 mice, L1: 108 branch tips. L2/3: 155 branch tips) (# denotes a time point measurement equaling 0 ± 0.00 % dynamic branch tips / wk) (** p < 0.02, * p < 0.05). Error bars, s.e.m.
Figure 6
Figure 6
Early period of monocular deprivation increases inhibitory synapse elimination onto L5 pyramidal apical dendrites. (a) High-magnification view of axonal bouton remodeling of superficial L2/3 interneuron. Yellow arrow indicates stable boutons. Red arrow indicates an eliminated bouton. (b) Fraction of total axonal boutons added or eliminated during normal vision or in response to 4 days of monocular deprivation. (n = 6 cells from 6 mice, 564 axonal boutons) (** p < 0.01, *p < 0.05). (c) Coronal section of a GFP-labeled L2/3 pyramidal neuron in binocular visual cortex (in green) after immunohistochemical staining of inhibitory pre-synaptic terminals by VGAT (in red). Examples of inhibitory presynaptic contacts onto dendritic (top-right panel) and perisomatic (bottom-right panel) synapses are indicated with white arrows. (d) Quantification of putative inhibitory synapse density on L2/3 pyramidal neuron soma and on dendrites of L2/3 and L5 pyramidal neurons in binocular visual cortex after four days of monocular deprivation. (control; n=8 mice, 49 L2/3 pyramidal neurons, 45 L5 pyramid neurons, 9688 synapses, 4d monocular deprivation n = 8, 46 L2/3 pyramidal neurons, 39 L5 pyramid neurons, 8581 synapses) (*p < 0.05). Error bars, s.e.m. Scale bars: (a, c - top-right, c -bottom-left panel), 2 µm; (c - left panel), 5 µm.
Figure 7
Figure 7
Reduction in intracortical inhibition by fluoxetine treatment promotes experience-dependent branch tip remodeling. (a) Experimental time course. (b) High-magnification view of one branch tip retraction during fluoxetine treatment. Red arrow marks the approximate distal end of the branch tip at −28d. Scale bar: 10 µm. (c) Dendritic branch tip dynamics in L1 and L2/3 of binocular visual cortex of animals under normal vision before and during fluoxetine administration. Rates of L2/3 branch tip elongations and retractions in binocular visual cortex during fluoxetine treatment under normal vision or a brief 4d monocular deprivation as compared to prolonged 7d monocular deprivation without fluoxetine treatment (taken from Fig 4c.) (with fluoxetine, n = 8 cells from 8 mice, L1: 113 branch tips, L2/3: 115 branch tips; without fluoxetine, n = 16 cells from 13 mice, L2/3: 325 branch tips). (** p < 0.01; * p < 0.05). Error bars, s.e.m.

Similar articles

Cited by

References

    1. Rubenstein JL, Merzenich MM. Model of autism: increased ratio of excitation/inhibition in key neural systems. Genes Brain Behav. 2003;2:255–267. - PMC - PubMed
    1. Dani VS, et al. Reduced cortical activity due to a shift in the balance between excitation and inhibition in a mouse model of Rett syndrome. Proc Natl Acad Sci U S A. 2005;102:12560–12565. - PMC - PubMed
    1. Kleschevnikov AM, et al. Hippocampal long-term potentiation suppressed by increased inhibition in the Ts65Dn mouse, a genetic model of Down syndrome. J Neurosci. 2004;24:8153–8160. - PMC - PubMed
    1. Fernandez F, et al. Pharmacotherapy for cognitive impairment in a mouse model of Down syndrome. Nat Neurosci. 2007;10:411–413. - PubMed
    1. Harauzov A, et al. Reducing intracortical inhibition in the adult visual cortex promotes ocular dominance plasticity. J Neurosci. 2010;30:361–371. - PMC - PubMed

Publication types

MeSH terms

Substances