. 2011 May;14(5):555-61.
doi: 10.1038/nn.2807. Epub 2011 Apr 10.

A new subtype of progenitor cell in the mouse embryonic neocortex

Affiliations

A new subtype of progenitor cell in the mouse embryonic neocortex

Xiaoqun Wang et al. Nat Neurosci. 2011 May.

Abstract

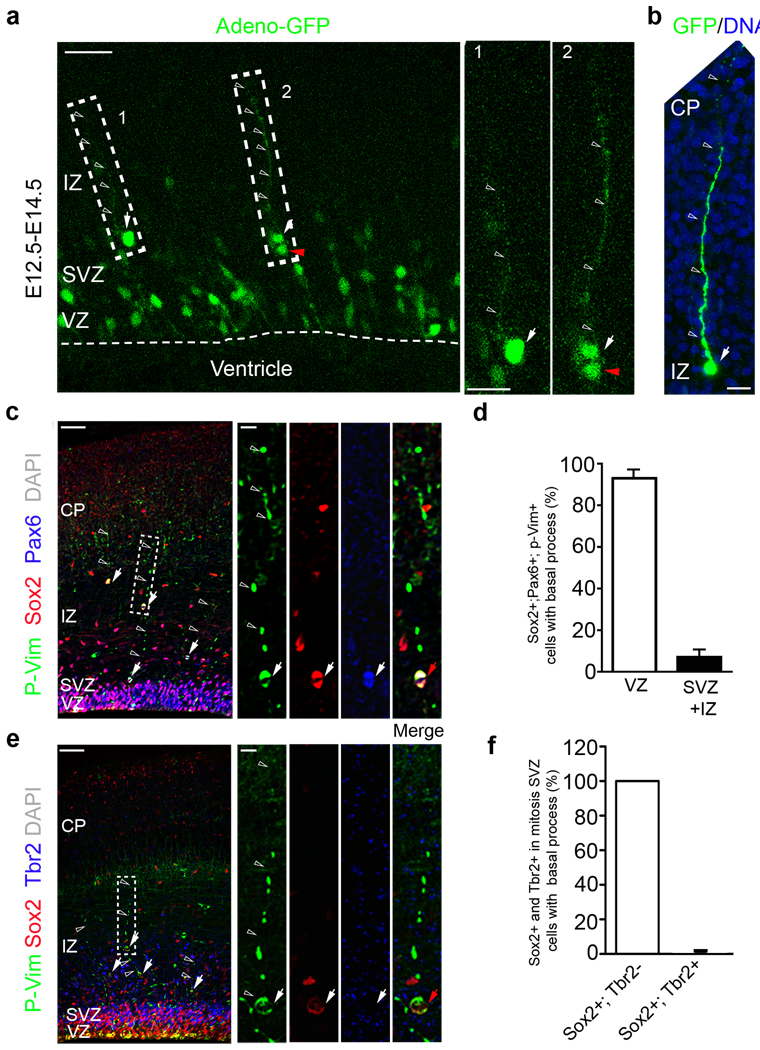
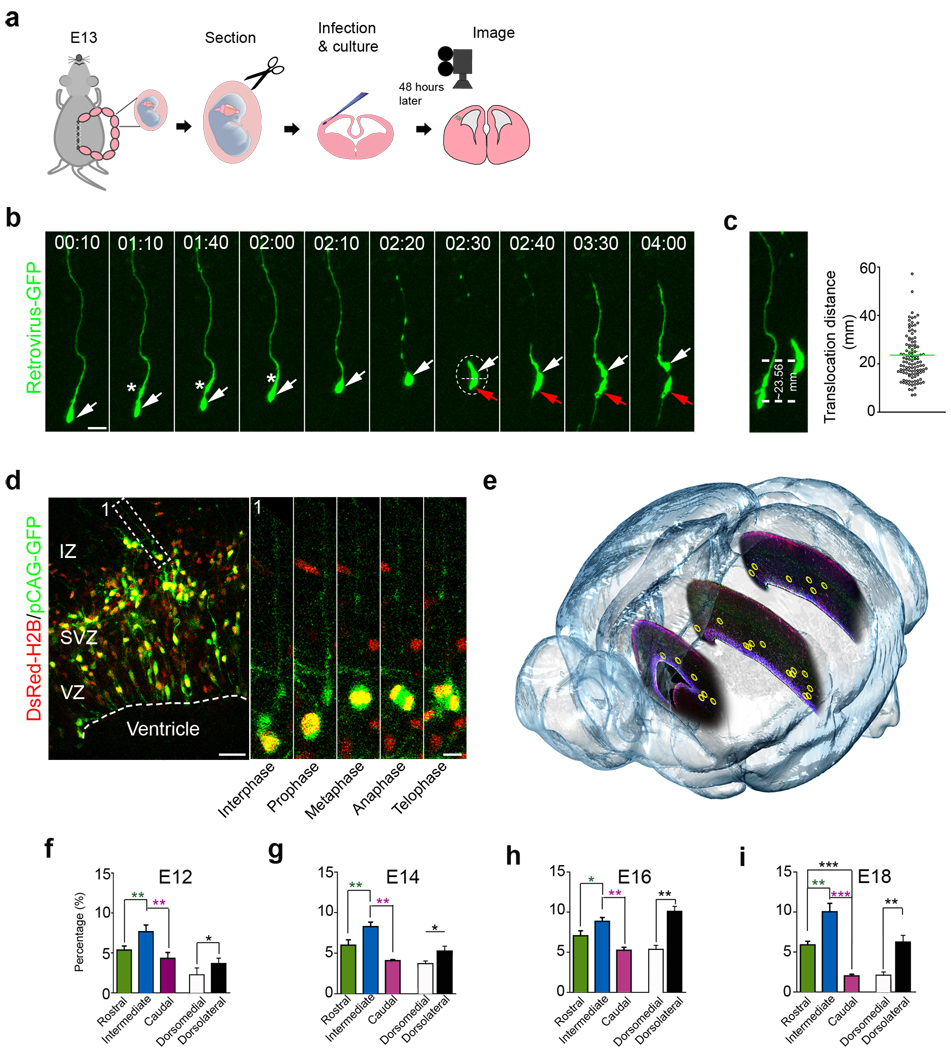
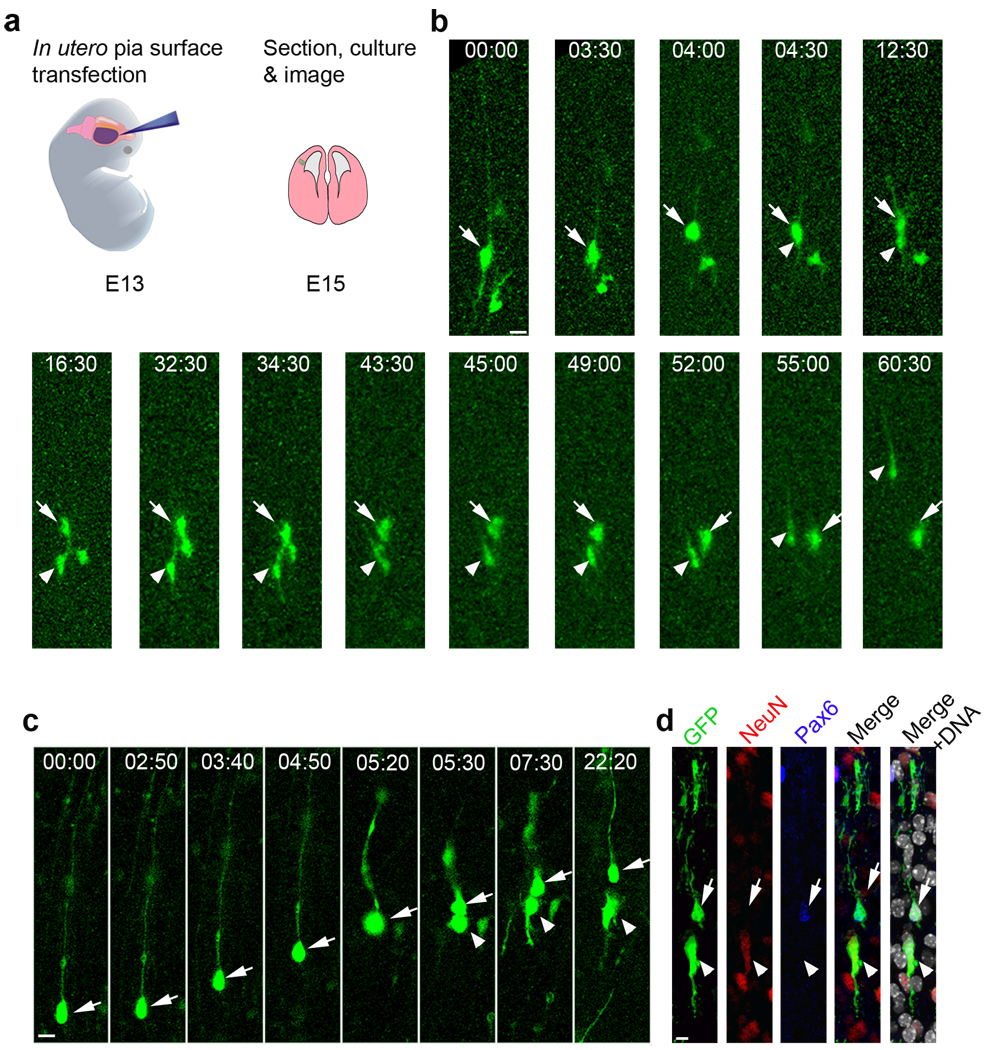
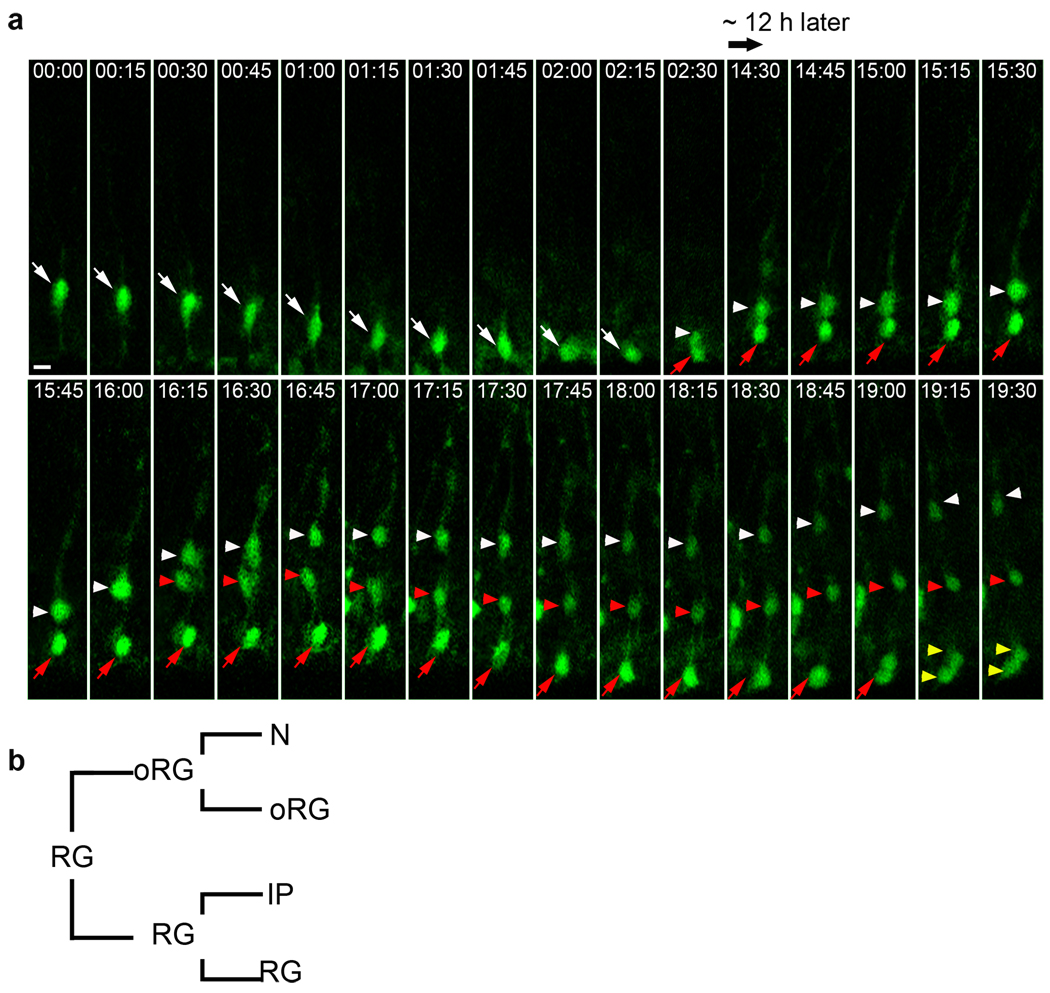
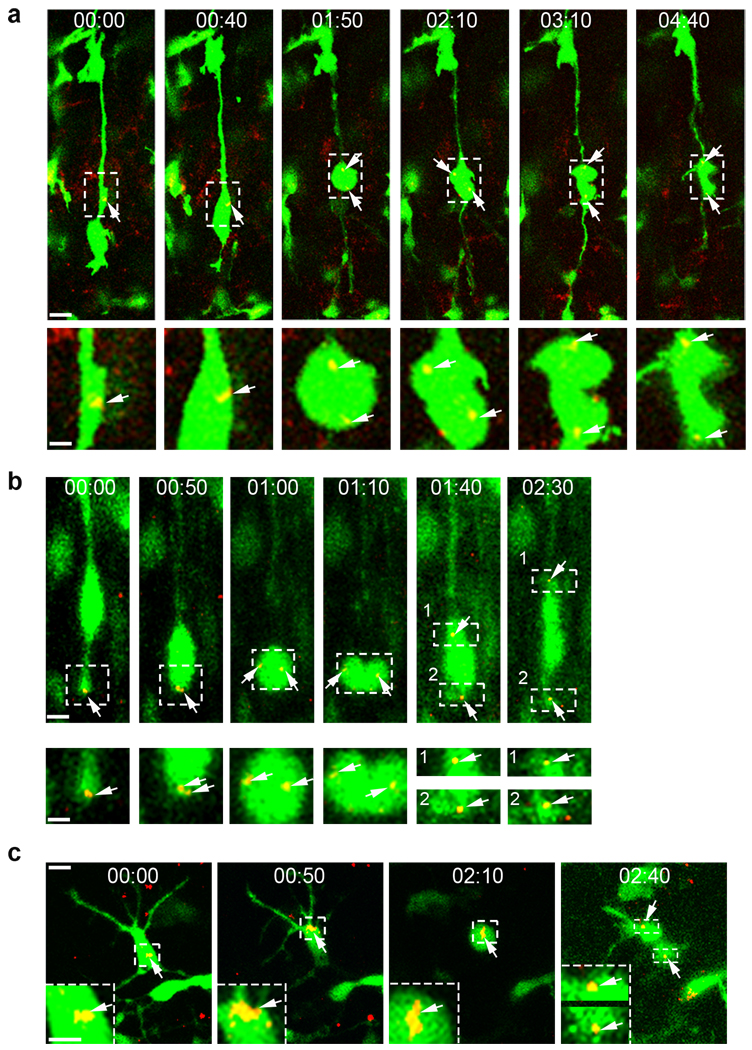
A hallmark of mammalian brain evolution is cortical expansion, which reflects an increase in the number of cortical neurons established by the progenitor cell subtypes present and the number of their neurogenic divisions. Recent studies have revealed a new class of radial glia-like (oRG) progenitor cells in the human brain, which reside in the outer subventricular zone. Expansion of the subventricular zone and appearance of oRG cells may have been essential evolutionary steps leading from lissencephalic to gyrencephalic neocortex. Here we show that oRG-like progenitor cells are present in the mouse embryonic neocortex. They arise from asymmetric divisions of radial glia and undergo self-renewing asymmetric divisions to generate neurons. Moreover, mouse oRG cells undergo mitotic somal translocation whereby centrosome movement into the basal process during interphase precedes nuclear translocation. Our finding of oRG cells in the developing rodent brain fills a gap in our understanding of neocortical expansion.


Figures

Figure 1
Figure 1. oRG cells in the developing mouse neocortex
(a) Labelling of RG and oRG-like cells with Adeno-GFP. Note the oRG-like cell (box 1) that has a long basal process (open arrowhead) but no apical process. High magnification images are shown to the right (1 and 2). Scale bars: 50 µm and 15 µm. (b) Representative oRG-like cell (arrow), open arrowheads indicate the basal process. Scale bars: 25 µm. (c) Phosphovimentin (P-Vim, green) labels oRG cells in mitosis. The basal process has varicosities characteristic of M-phase oRG cells. The oRG-like cells co-stain with radial glial progenitor markers Pax6 (blue) and Sox2 (red). Arrows indicate triple positive oRG-like cells; open arrowheads indicate the basal process. Scale bars: 50 µm and 10 µm. (d) Quantification of the percentage of mitotic, basal process bearing oRG-like cells identified by P-Vim+, Pax6+, and Sox2+ immunostaining in the VZ (92.95 ± 5.90%) and superficial SVZ (7.05 ± 3.70%) (Total 78 cells from six animals). (e) Phosphovimentin+ (green) oRG cells at E16.5 co-stain for Sox2 (red) but are Tbr2 (blue, an intermediate progenitor marker). High magnification images of a representative outlined cell are shown to the right. Arrows indicate oRG-like cells co-stained for P-Vim (green) and Sox2 (red), open arrowheads indicate the basal process. Scale bars: 50 µm and 10 µm. (f) Quantification of the percentage of oRG-like cells identified by P-Vim+/Sox2+/Tbr2+ (0 %) or P-Vim+/Sox2+/Tbr2 (100%) in the superficial SVZ (Total 46 cells from six animals).
Figure 2
Figure 2. oRG cells undergo mitotic somal translocation
(a) Experimental procedure for time-lapse. (b) oRG-like cells undergo mitotic somal translocation before mitosis (see supplementary Movie 1). Arrows indicate oRG-like cells (white) and a non-oRG daughter (red). An asterix indicates the characteristic swelling in the proximal basal process. A dashed line indicates the cleavage plane. Scale bar: 20 µm. (c) Quantification of mitotic somal translocation distances. Average distance 23.56 ± 1.56 µm (from 114 time-lapse sequences). (d) Dual-labelled oRG cell (broken box, cell 1) 1d after electroporation in utero at E13.5. High magnification images of mitotic cell behaviour from the outlined regions (right). Scale bar: 50 µm and 10 µm. (e) 3D illustration of oRG cell distribution pattern in E16 brain. Yellow donut-shape circles indicate the locations of mouse oRG cells. (f–i) Quantification of the percentage of Pax6+/P-Vim+/Sox2+ triple positive cells located in the outer region of the VZ and SVZ versus total triple positive cells located in the entire developing neocortex. *, p<0.05; **, p<0.005; ***, p<0.001.
Figure 3
Figure 3. oRG cells generate neurons
(a) Experimental procedure for time-lapse analysis of oRG-like cell behaviour by in utero pial surface injection of EGFP expressing adenovirus (Adeno-GFP). (b) Time-lapse images of daughter neuron migration following oRG division. The apical daughter cell becomes bipolar after ~ 30h and migrates radially (see supplementary Movie 4). White arrows indicate the oRG cell and yellow arrows indicate the daughter oRG cell after division. Yellow arrowheads indicate the neuron daughter. Scale bar: 15 µm. (c) Asymmetric division of an oRG cell (arrows) generates a self-renewed oRG cell (arrows) and a daughter neuron (arrowheads, see supplementary Movie 5). (d) The oRG daughter was Pax6+ (a neuronal stem cell marker, blue), and the non-oRG daughter was NeuN+ (a neuronal marker, red) after 12h more in culture. Scale bar: 10 µm.
Figure 4
Figure 4. oRG cells originate from RG cells
(a) Time-lapse image of RG cell division. A GFP-labelled RG cell was monitored at 15m intervals (white arrow) 2d after in-utero intra-ventricular retrovirus infection in E11.5. Asymmetric RG cell division generates a self-renewed RG cell (red arrow), which divides again (yellow arrowheads). The first RG daughter cell (white arrowhead) undergoes mitotic somal translocation and divides (white and red arrowheads follow the two daughter cells after oRG division) (see supplementary Movie 6). Scale bar: 10 µm. (b) Lineage tree of RG and oRG cell divisions. RG cells can divide asymmetrically to self-renew and generate oRG cells. Both progenitors can divide again to self-renew and generate daughter cells including neurons (N) and intermediate progenitors (IP).
Figure 5
Figure 5. Distinct behaviour of centrosomes in different progenitor cells
(a–c) Time-lapse images of centrosome dynamics in oRG cells (a, see supplementary Movie 7), RG cells (b, see supplementary Movie 8) and IP cells (c, see supplementary Movie 9). High magnification images from the outlined regions are shown (a, b, c). Arrows indicate centrosomes. Scale bars: a–c, 10 µm and 2.5 µm.

Comment in

References

    1. Fishell G, Kriegstein AR. Neurons from radial glia: the consequences of asymmetric inheritance. Curr Opin Neurobiol. 2003;13:34–41. - PubMed
    1. Kriegstein A, Alvarez-Buylla A. The glial nature of embryonic and adult neural stem cells. Annu Rev Neurosci. 2009;32:149–184. - PMC - PubMed
    1. Kriegstein A, Noctor S, Martinez-Cerdeno V. Patterns of neural stem and progenitor cell division may underlie evolutionary cortical expansion. Nat Rev Neurosci. 2006;7:883–890. - PubMed
    1. Rakic P. Evolution of the neocortex: a perspective from developmental biology. Nat Rev Neurosci. 2009;10:724–735. - PMC - PubMed
    1. Rakic P. Specification of cerebral cortical areas. Science. 1988;241:170–176. - PubMed

Publication types

MeSH terms