Comparative Study
. 2011 May;43(5):476-81.
doi: 10.1038/ng.807. Epub 2011 Apr 10.

The Arabidopsis lyrata genome sequence and the basis of rapid genome size change

Affiliations
Comparative Study

The Arabidopsis lyrata genome sequence and the basis of rapid genome size change

Tina T Hu et al. Nat Genet. 2011 May.

Abstract

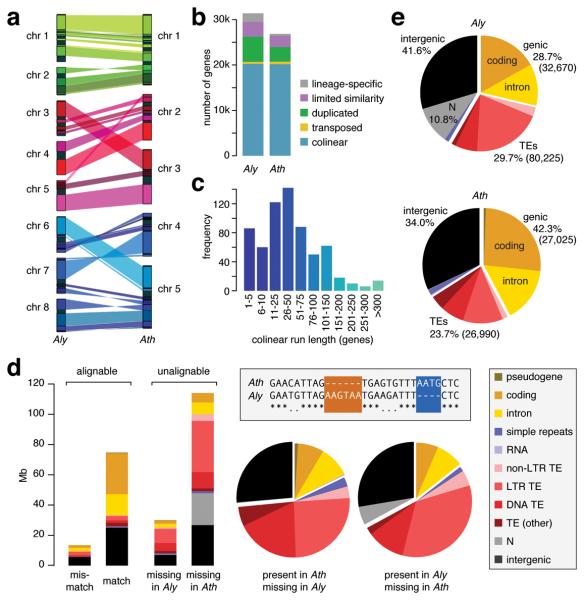
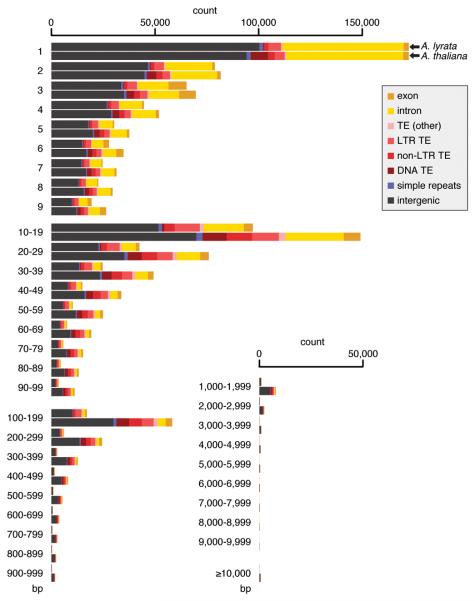
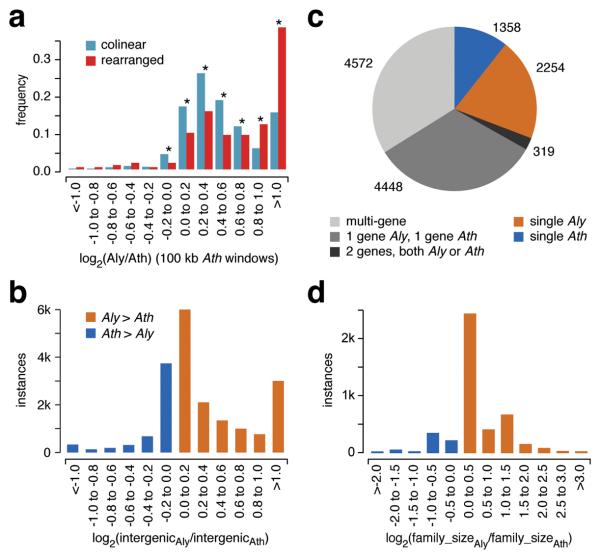
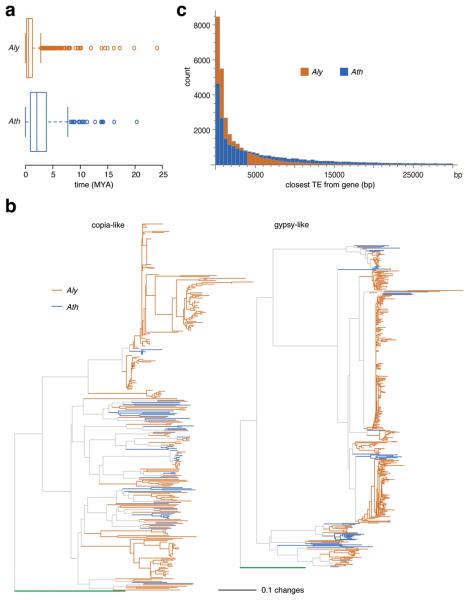
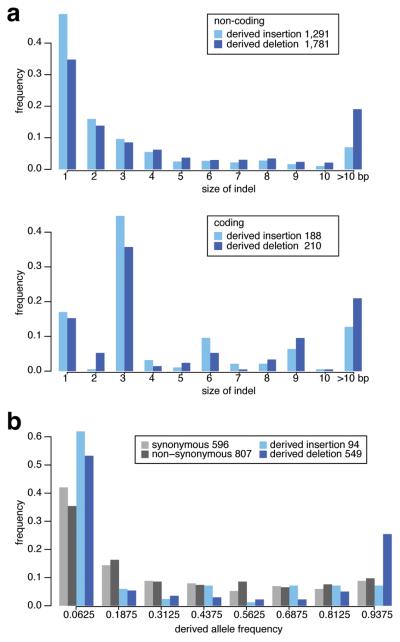
We report the 207-Mb genome sequence of the North American Arabidopsis lyrata strain MN47 based on 8.3× dideoxy sequence coverage. We predict 32,670 genes in this outcrossing species compared to the 27,025 genes in the selfing species Arabidopsis thaliana. The much smaller 125-Mb genome of A. thaliana, which diverged from A. lyrata 10 million years ago, likely constitutes the derived state for the family. We found evidence for DNA loss from large-scale rearrangements, but most of the difference in genome size can be attributed to hundreds of thousands of small deletions, mostly in noncoding DNA and transposons. Analysis of deletions and insertions still segregating in A. thaliana indicates that the process of DNA loss is ongoing, suggesting pervasive selection for a smaller genome. The high-quality reference genome sequence for A. lyrata will be an important resource for functional, evolutionary and ecological studies in the genus Arabidopsis.


Figures

Figure 1
Figure 1
Comparison of A. lyrata and A. thaliana genomes. (a) Alignment of A. lyrata (Aly) and A. thaliana (Ath) chromosomes. Genomes are scaled to equal size. Only syntenic blocks of at least 500 kb are connected. (b) Orthology classification of genes. (c) Distribution of run lengths of collinear genes. The mode at 1-5 reflects frequent single-gene transpositions. (d) Unalignable sites can be considered as present in one species and absent in the other, as shown in the boxed sequence diagram; matches are indicated by asterisks, and mismatches by periods. The histogram on the left indicates the absolute number of unalignable sites, and the pie charts in the middle compare their relative distribution over different genomic features. See also Supplementary Table 3. (e) Genome composition (number of elements in parentheses).
Figure 2
Figure 2
Apparent deletions by size and annotation. A. lyrata is always shown on top, A. thaliana on bottom.
Figure 3
Figure 3
Changes in genomic intervals along the A. thaliana genome. Mean ratios for all collinear gene pairs in each 100 kb window are shaded in blue, with individual values shown as light blue dots. The ratio of the absolute length of each non-overlapping 100 kb window is shown as a dark purple line. Centromeres are indicated as grey boxes.
Figure 4
Figure 4
Change in size of collinear and rearranged regions, intergenic regions and gene families. (a) Size comparison of collinear regions, relative to 100 kb windows in A. thaliana. Asterisks indicate significant differences (binomial test, p<0.001). (b) Relative size of intergenic regions. (c) MCL clusters. (d) Relative size of gene families.
Figure 5
Figure 5
Comparison of transposable elements. (a) Estimated insertion times of LTR retrotransposons, based on the experimentally determined mutation rate for A. thaliana. The whiskers indicate values up to 1.5 times the interquartile range. The difference between the species is highly significant (Wilcoxon rank sum test, p<2.2×10⁻¹⁶). (b) Phylogeny of Ty1/copia-like and Ty3/gypsy-like LTR retrotransposons. S. cerevisiae Ty1 and Ty3 used as outgroups are indicated in green. (c) Distances of nearest TE from each gene. The difference between the two species is not simply due to fewer transposable elements in the A. thaliana genome (Supplementary Table 8 and Supplementary Fig. 7).
Figure 6
Figure 6
Sizes and allele frequency distribution of insertions and deletions that are either fixed or still segregating in 95 A. thaliana individuals and that are presumed to be derived based on comparison with the A. lyrata allele. (a) Size distribution of fixed insertions and deletions. Insertions and deletions that are multiples of a single codon (3 bp) are overrepresented in coding regions. (b) Allele frequency of segregating non-coding insertion and deletion frequencies compared to that of synonymous and non-synonymous polymorphisms.

References

    1. Greilhuber J, et al. Smallest angiosperm genomes found in Lentibulariaceae, with chromosomes of bacterial size. Plant Biol. 2006;8:770–7. - PubMed
    1. Gregory TR, et al. Eukaryotic genome size databases. Nucleic Acids Res. 2007;35:D332–8. - PMC - PubMed
    1. Gaut BS, Ross-Ibarra J. Selection on major components of angiosperm genomes. Science. 2008;320:484–6. - PubMed
    1. Pellicer J, Fay MF, Leitch IJ. The largest eukaryotic genome of them all? Botanical Journal of the Linnean Society. 2010;164:10–15.
    1. Bennetzen JL, Ma J, Devos KM. Mechanisms of recent genome size variation in flowering plants. Ann. Bot. 2005;95:127–32. - PMC - PubMed

Publication types

Associated data