Variable cultural acquisition costs constrain cumulative cultural evolution
- PMID: 21479170
- PMCID: PMC3068160
- DOI: 10.1371/journal.pone.0018239
Variable cultural acquisition costs constrain cumulative cultural evolution
Abstract
One of the hallmarks of the human species is our capacity for cumulative culture, in which beneficial knowledge and technology is accumulated over successive generations. Yet previous analyses of cumulative cultural change have failed to consider the possibility that as cultural complexity accumulates, it becomes increasingly costly for each new generation to acquire from the previous generation. In principle this may result in an upper limit on the cultural complexity that can be accumulated, at which point accumulated knowledge is so costly and time-consuming to acquire that further innovation is not possible. In this paper I first review existing empirical analyses of the history of science and technology that support the possibility that cultural acquisition costs may constrain cumulative cultural evolution. I then present macroscopic and individual-based models of cumulative cultural evolution that explore the consequences of this assumption of variable cultural acquisition costs, showing that making acquisition costs vary with cultural complexity causes the latter to reach an upper limit above which no further innovation can occur. These models further explore the consequences of different cultural transmission rules (directly biased, indirectly biased and unbiased transmission), population size, and cultural innovations that themselves reduce innovation or acquisition costs.
Conflict of interest statement
Figures


 max and N for direct bias, indirect bias and unbiased transmission, and with N plotted on a logarithmic scale. For direct bias, maximum cultural complexity
  max increases logarithmically with N up to N = 100 (line is a logarithmic best-fit with R2 = 0.991 for N≤100), after which it plateaus. For indirect bias, a similar logarithmic increase followed by a plateau occurs to that under direct bias, but the values of
  max are lower and the plateau occurs at higher values of N (around N = 1000; line is a logarithmic best-fit with R2 = 0.994 for N≤1000). For unbiased transmission, N has no effect on
  max. Parameters: ci = 10, cs = 5, λ = 1000, µi = µs = 0, all results are the average of 100 independent runs.
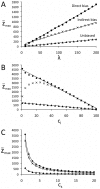
 max and λ for direct bias (R2 = 0.999), indirect bias (R2 = 0.991) and unbiased transmission (R2 = 0.998); in (B) showing a negative linear relationship between
  max and ci for direct bias (R2 = 0.995) and unbiased transmission (R2 = 0.999), but for indirect bias only for larger ci values (for ci>30, R2 = 0.990), with lower ci values generating lower
  max values than expected (no best-fit line drawn); and in (C) showing an inverse power law relationship between
  max and cs for direct bias (R2 = 0.997), indirect bias (R2 = 0.997) and unbiased transmission (R2 = 0.992). Other parameters: N = 100, X = 100, µi = µs = 0, all results are the average of 100 independent runs.
References
-
- Tomasello M. Cambridge, MA: Harvard University Press; 1999. The cultural origins of human cognition.
-
- Boyd R, Richerson PJ. Why culture is common, but cultural evolution is rare. Proceedings of The British Academy. 1996;88:77–93.
-
- Whiten A, Goodall J, McGrew WC, Nishida T, Reynolds V, et al. Cultures in chimpanzees. Nature. 1999;399:682–685. - PubMed
-
- Catchpole CK, Slater PJB. Cambridge: Cambridge University Press; 1995. Bird song: Biological themes and variations.
MeSH terms
LinkOut - more resources
Full Text Sources

