. 2011 Mar 29;6(3):e18202.
doi: 10.1371/journal.pone.0018202.

Integrated analysis of multiple microarray datasets identifies a reproducible survival predictor in ovarian cancer

Affiliations

Integrated analysis of multiple microarray datasets identifies a reproducible survival predictor in ovarian cancer

Panagiotis A Konstantinopoulos et al. PLoS One. .

Abstract

Background: Public data integration may help overcome challenges in clinical implementation of microarray profiles. We integrated several ovarian cancer datasets to identify a reproducible predictor of survival.

Methodology/principal findings: Four microarray datasets from different institutions comprising 265 advanced stage tumors were uniformly reprocessed into a single training dataset, also adjusting for inter-laboratory variation ("batch-effect"). Supervised principal component survival analysis was employed to identify prognostic models. Models were independently validated in a 61-patient cohort using a custom array genechip and a publicly available 229-array dataset. Molecular correspondence of high- and low-risk outcome groups between training and validation datasets was demonstrated using Subclass Mapping. Previously established molecular phenotypes in the 2(nd) validation set were correlated with high and low-risk outcome groups. Functional representational and pathway analysis was used to explore gene networks associated with high and low risk phenotypes. A 19-gene model showed optimal performance in the training set (median OS 31 and 78 months, p < 0.01), 1(st) validation set (median OS 32 months versus not-yet-reached, p = 0.026) and 2(nd) validation set (median OS 43 versus 61 months, p = 0.013) maintaining independent prognostic power in multivariate analysis. There was strong molecular correspondence of the respective high- and low-risk tumors between training and 1(st) validation set. Low and high-risk tumors were enriched for favorable and unfavorable molecular subtypes and pathways, previously defined in the public 2(nd) validation set.

Conclusions/significance: Integration of previously generated cancer microarray datasets may lead to robust and widely applicable survival predictors. These predictors are not simply a compilation of prognostic genes but appear to track true molecular phenotypes of good- and poor-outcome.


Conflict of interest statement

Competing Interests: The authors have declared that no competing interests exist.

Figures

Figure 1
Figure 1. Consort Diagram (Study work flow).
Raw data (Affymetrix .CEL files) from four previously reported microarray datasets from different institutions were used. Outlier samples were excluded and batch effect was adjusted resulting in the final training set (239 arrays). 650 genes were selected by performing survival analysis in each dataset and were used to develop prognostic models in the final training set. Data pre-processing (quality control and batch adjustment) and normalization resulting in an integrated training set was done separately from the selection of 650 genes, which were chosen independently by performing survival analysis in each of the 4 datasets (MD ANDERSON, PENN, DUKE, BIDMC). These preselected 650 genes were then used to develop prognostic models in the unified training set. These models were independently validated in two independent datasets: a 61-tumor cohort using a custom array containing the 650 preselected genes and a 229-tumor recently published ovarian cancer microarray dataset. The correspondence of the low- and high-risk phenotypes was assessed using SubMap.
Figure 2
Figure 2. Adjustment for non-biological experimental variation.
Multidimensional scaling of the combined training set revealed that, before application of the batch adjustment algorithm, each dataset clearly separated from all the others (“batch effect”), whereas after correction of batch effect, samples from all datasets were well intermixed.
Figure 3
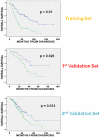
Figure 3. Association between 19-gene model and overall survival in the training and validation sets.
The 19-gene model distinguished between a high and a low-risk group in the training set with a median OS of 31 months and 78 months respectively (log rank p<0.01, permutation p = 0.02), a high and a low-risk group for OS in the 1st validation set (median OS 32 months versus not-yet-reached respectively, log rank p = 0.026), and a high and a low-risk group for OS in the 2nd validation set (median OS 43 months versus 61 months respectively, log rank p = 0.013).
Figure 4
Figure 4. Independent prognostic significance of the multigene classifiers adjusted for known clinical and pathologic prognostic factors.
A) Prognostic value of the 19-Gene expression profile adjusted for known prognostic factors by Cox Proportional Hazards Regression in the training and 1st validation sets. B) Kaplan-Meier analysis for OS as a function of the 19-gene profile for homogeneous subsets of patients with optimal and suboptimal debulking status in the training set. C) The combination of optimal debulking and low-risk 19-gene profile was associated with a median OS of 119 months in the training set and not-yet-reached in the validation set, while the combination of suboptimal debulking and high-risk 19-gene profile was associated with a median OS of 23 months in the training set (HR = 7.3, 95% C.I. 3.4–13.5) and 21 months in the 1st validation set (HR = 5.8, 95% C.I. 2.1–16).
Figure 5
Figure 5. A) Genome-wide molecular correspondence of high and low-risk groups between training and 1st validation set.
SubMap analysis of genome-wide correspondence (similarity) between respective high and low risks groups in the training and 1st validation set. The legend shows the relationship between color and FDR-adjusted p-values. Red color denotes high confidence for correspondence; blue color denotes lack of correspondence (Table S1). B) Functional gene set analysis and functional representational analysis in high and low-risk disease samples. Gene set analysis (GSA) over a wide range of differentially expressed genes revealed 8 pathways that were consistently statistically significantly differentially expressed. (Efron-Tibshirani GSA, p<0.05). Selected pathways-gene sets are shown that were overrepresented among high-risk and low-risk tumors by functional representational analysis using EASE (within-system FDR ≤0.01). A full list of these pathways is found in Tables S2, S3 and S4. Asterisks (*) denote pathways that were similarly expressed in corresponding prognostic groups in the 2nd validation set.

References

    1. Cannistra SA. Cancer of the ovary. N Engl J Med. 2004;351:2519–2529. - PubMed
    1. McGuire WP, Hoskins WJ, Brady MF, Kucera PR, Partridge EE, et al. Cyclophosphamide and cisplatin compared with paclitaxel and cisplatin in patients with stage III and stage IV ovarian cancer. N Engl J Med. 1996;334:1–6. - PubMed
    1. Ozols RF, Bundy BN, Greer BE, Fowler JM, Clarke-Pearson D, et al. Phase III trial of carboplatin and paclitaxel compared with cisplatin and paclitaxel in patients with optimally resected stage III ovarian cancer: a Gynecologic Oncology Group study. J Clin Oncol. 2003;21:3194–3200. - PubMed
    1. Bristow RE, Tomacruz RS, Armstrong DK, Trimble EL, Montz FJ. Survival effect of maximal cytoreductive surgery for advanced ovarian carcinoma during the platinum era: a meta-analysis. J Clin Oncol. 2002;20:1248–1259. - PubMed
    1. Thigpen T, Brady MF, Omura GA, Creasman WT, McGuire WP, et al. Age as a prognostic factor in ovarian carcinoma. The Gynecologic Oncology Group experience. Cancer. 1993;71:606–614. - PubMed

Publication types

MeSH terms