

Use of the ODD-luciferase transgene for the non-invasive imaging of spontaneous tumors in mice
- PMID: 21479246
- PMCID: PMC3066234
- DOI: 10.1371/journal.pone.0018269
Use of the ODD-luciferase transgene for the non-invasive imaging of spontaneous tumors in mice
Abstract
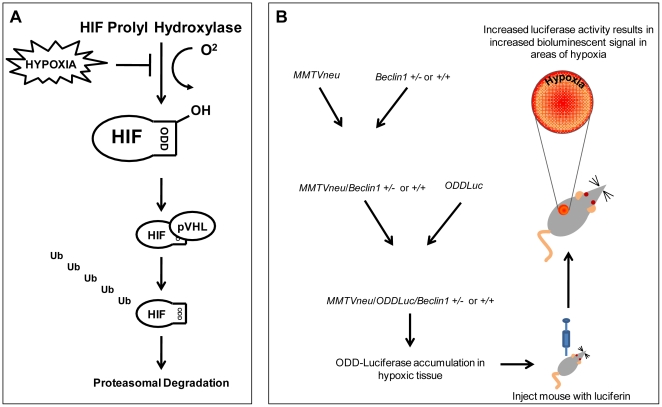
Background: In humans, imaging of tumors provides rapid, accurate assessment of tumor growth and location. In laboratory animals, however, the imaging of spontaneously occurring tumors continues to pose many technical and logistical problems. Recently a mouse model was generated in which a chimeric protein consisting of HIF-1α oxygen-dependent degradation domain (ODD) fused to luciferase was ubiquitously expressed in all tissues. Hypoxic stress leads to the accumulation of ODD-luciferase in the tissues of this mouse model which can be identified by non-invasive bioluminescence measurement. Since solid tumors often contain hypoxic regions, we performed proof-of-principle experiments testing whether this transgenic mouse model may be used as a universal platform for non-invasive imaging analysis of spontaneous solid tumors.
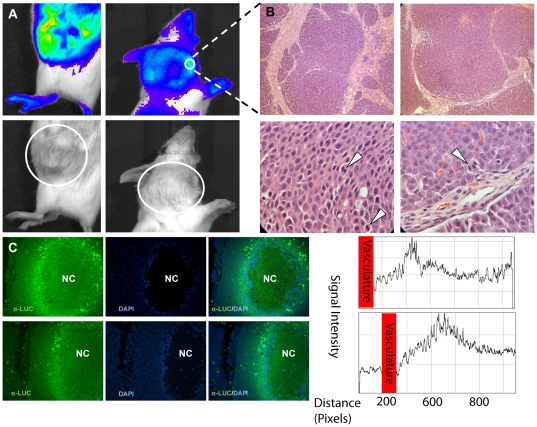
Methods and materials: ODD-luciferase transgenic mice were bred with MMTV-neu/beclin1+/- mice. Upon injection of luciferin, bioluminescent background of normal tissues in the transgenic mice and bioluminescent signals from spontaneously mammary carcinomas were measured non-invasively with an IVIS Spectrum imaging station. Tumor volumes were measured manually and the histology of tumor tissues was analyzed.
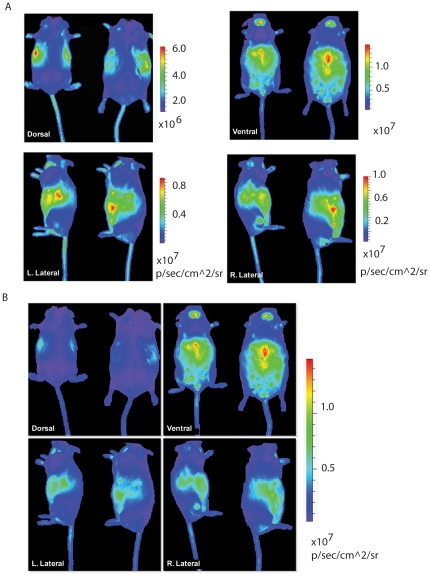
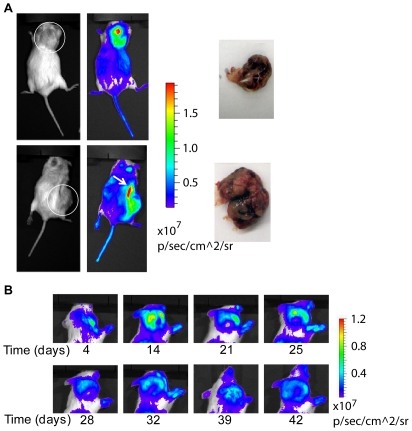
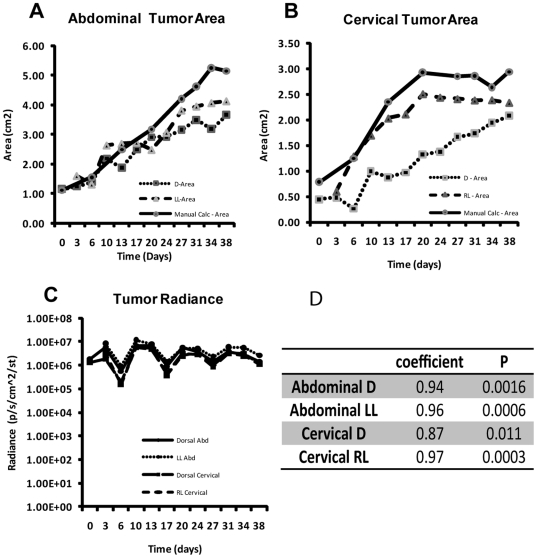
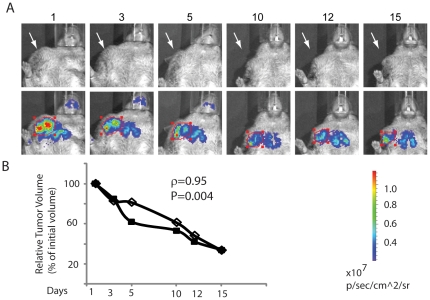
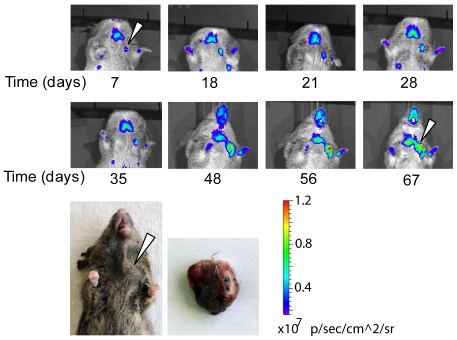
Conclusion: Our results show that spontaneous mammary tumors in ODD-luciferase transgenic mice generate substantial bioluminescent signals, which are clearly discernable from background tissue luminescence. Moreover, we demonstrate a strong quantitative correlation between the bioluminescent tumor contour and the volume of palpable tumors. We further demonstrate that shrinkage of the volume of spontaneous tumors in response to chemotherapeutic treatment can be determined quantitatively using this system. Finally, we show that the growth and development of spontaneous tumors can be monitored longitudinally over several weeks. Thus, our results suggest that this model could potentially provide a practical, reliable, and cost-effective non-invasive quantitative method for imaging spontaneous solid tumors in mice.
Conflict of interest statement
Figures
Similar articles
-
The bioluminescent imaging of spontaneously occurring tumors in immunocompetent ODD-luciferase bearing transgenic mice.Methods Mol Biol. 2014;1098:129-43. doi: 10.1007/978-1-62703-718-1_11. Methods Mol Biol. 2014. PMID: 24166374
-
Generation of a new bioluminescent model for visualisation of mammary tumour development in transgenic mice.BMC Cancer. 2012 May 30;12:209. doi: 10.1186/1471-2407-12-209. BMC Cancer. 2012. PMID: 22646761 Free PMC article.
-
Hypoxia-regulated expression of attenuated diphtheria toxin A fused with hypoxia-inducible factor-1alpha oxygen-dependent degradation domain preferentially induces apoptosis of hypoxic cells in solid tumor.Cancer Res. 2005 Dec 15;65(24):11622-30. doi: 10.1158/0008-5472.CAN-05-0111. Cancer Res. 2005. PMID: 16357173
-
TGF beta regulation of cell proliferation.Princess Takamatsu Symp. 1994;24:250-63. Princess Takamatsu Symp. 1994. PMID: 8983080 Review.
-
Potential Limitations of Bioluminescent Xenograft Mouse Models: A Systematic Review.J Pharm Pharm Sci. 2020;23:177-199. doi: 10.18433/jpps30870. J Pharm Pharm Sci. 2020. PMID: 32407285
Cited by
-
Dynamics of tumor hypoxia in response to patupilone and ionizing radiation.PLoS One. 2012;7(12):e51476. doi: 10.1371/journal.pone.0051476. Epub 2012 Dec 10. PLoS One. 2012. PMID: 23251549 Free PMC article.
-
Imaging to study solid tumour origin and progression: lessons from research and clinical oncology.Immunol Cell Biol. 2017 Jul;95(6):531-537. doi: 10.1038/icb.2017.17. Epub 2017 Mar 15. Immunol Cell Biol. 2017. PMID: 28294139 Review.
-
Proteasome function is not impaired in healthy aging of the lung.Aging (Albany NY). 2015 Oct;7(10):776-92. doi: 10.18632/aging.100820. Aging (Albany NY). 2015. PMID: 26540298 Free PMC article.
-
Interrogation of gossypol therapy in glioblastoma implementing cell line and patient-derived tumour models.Br J Cancer. 2014 Dec 9;111(12):2275-86. doi: 10.1038/bjc.2014.529. Epub 2014 Nov 6. Br J Cancer. 2014. PMID: 25375271 Free PMC article.
-
In vitro ischemia suppresses hypoxic induction of hypoxia-inducible factor-1α by inhibition of synthesis and not enhanced degradation.J Neurosci Res. 2013 Aug;91(8):1066-75. doi: 10.1002/jnr.23204. Epub 2013 Mar 4. J Neurosci Res. 2013. PMID: 23456821 Free PMC article.
References
-
- Kyriazi S, Kaye SB, deSouza NM. Imaging ovarian cancer and peritoneal metastases–current and emerging techniques. Nat Rev Clin Oncol. 7:381–393. - PubMed
-
- Oyen WJ, van der Graaf WT. Molecular imaging of solid tumors: exploiting the potential. Nat Rev Clin Oncol. 2009;6:609–611. - PubMed
-
- Waldman AD, Jackson A, Price SJ, Clark CA, Booth TC, et al. Quantitative imaging biomarkers in neuro-oncology. Nat Rev Clin Oncol. 2009;6:445–454. - PubMed
-
- Dennis C. Cancer: off by a whisker. Nature. 2006;442:739–741. - PubMed
Publication types
MeSH terms
Substances
Grants and funding
LinkOut - more resources
Full Text Sources
Medical
Molecular Biology Databases
Research Materials
Miscellaneous
