A computational framework discovers new copy number variants with functional importance
- PMID: 21479260
- PMCID: PMC3066184
- DOI: 10.1371/journal.pone.0017539
A computational framework discovers new copy number variants with functional importance
Abstract
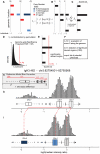
Structural variants which cause changes in copy numbers constitute an important component of genomic variability. They account for 0.7% of genomic differences in two individual genomes, of which copy number variants (CNVs) are the largest component. A recent population-based CNV study revealed the need of better characterization of CNVs, especially the small ones (<500 bp).We propose a three step computational framework (Identification of germline Changes in Copy Number or IgC2N) to discover and genotype germline CNVs. First, we detect candidate CNV loci by combining information across multiple samples without imposing restrictions to the number of coverage markers or to the variant size. Secondly, we fine tune the detection of rare variants and infer the putative copy number classes for each locus. Last, for each variant we combine the relative distance between consecutive copy number classes with genetic information in a novel attempt to estimate the reference model bias. This computational approach is applied to genome-wide data from 1250 HapMap individuals. Novel variants were discovered and characterized in terms of size, minor allele frequency, type of polymorphism (gains, losses or both), and mechanism of formation. Using data generated for a subset of individuals by a 42 million marker platform, we validated the majority of the variants with the highest validation rate (66.7%) was for variants of size larger than 1 kb. Finally, we queried transcriptomic data from 129 individuals determined by RNA-sequencing as further validation and to assess the functional role of the new variants. We investigated the possible enrichment for variant's regulatory effect and found that smaller variants (<1 Kb) are more likely to regulate gene transcript than larger variants (p-value = 2.04e-08). Our results support the validity of the computational framework to detect novel variants relevant to disease susceptibility studies and provide evidence of the importance of genetic variants in regulatory network studies.
Conflict of interest statement
Figures


Similar articles
-
Systematic inference of copy-number genotypes from personal genome sequencing data reveals extensive olfactory receptor gene content diversity.PLoS Comput Biol. 2010 Nov 11;6(11):e1000988. doi: 10.1371/journal.pcbi.1000988. PLoS Comput Biol. 2010. PMID: 21085617 Free PMC article.
-
Family-Based Benchmarking of Copy Number Variation Detection Software.PLoS One. 2015 Jul 21;10(7):e0133465. doi: 10.1371/journal.pone.0133465. eCollection 2015. PLoS One. 2015. PMID: 26197066 Free PMC article.
-
Concordance rate between copy number variants detected using either high- or medium-density single nucleotide polymorphism genotype panels and the potential of imputing copy number variants from flanking high density single nucleotide polymorphism haplotypes in cattle.BMC Genomics. 2020 Mar 4;21(1):205. doi: 10.1186/s12864-020-6627-8. BMC Genomics. 2020. PMID: 32131735 Free PMC article.
-
Free-access copy-number variant detection tools for targeted next-generation sequencing data.Mutat Res Rev Mutat Res. 2019 Jan-Mar;779:114-125. doi: 10.1016/j.mrrev.2019.02.005. Epub 2019 Feb 23. Mutat Res Rev Mutat Res. 2019. PMID: 31097148 Review.
-
An Evolutionary Perspective on the Impact of Genomic Copy Number Variation on Human Health.J Mol Evol. 2020 Jan;88(1):104-119. doi: 10.1007/s00239-019-09911-6. Epub 2019 Sep 14. J Mol Evol. 2020. PMID: 31522275 Review.
Cited by
-
A Mild PUM1 Mutation Is Associated with Adult-Onset Ataxia, whereas Haploinsufficiency Causes Developmental Delay and Seizures.Cell. 2018 Feb 22;172(5):924-936.e11. doi: 10.1016/j.cell.2018.02.006. Cell. 2018. PMID: 29474920 Free PMC article.
-
Variants at IRX4 as prostate cancer expression quantitative trait loci.Eur J Hum Genet. 2014 Apr;22(4):558-63. doi: 10.1038/ejhg.2013.195. Epub 2013 Sep 11. Eur J Hum Genet. 2014. PMID: 24022300 Free PMC article.
-
In-silico identification and functional validation of allele-dependent AR enhancers.Oncotarget. 2015 Mar 10;6(7):4816-28. doi: 10.18632/oncotarget.3019. Oncotarget. 2015. PMID: 25693204 Free PMC article.
-
NUDT21-spanning CNVs lead to neuropsychiatric disease and altered MeCP2 abundance via alternative polyadenylation.Elife. 2015 Aug 27;4:e10782. doi: 10.7554/eLife.10782. Elife. 2015. PMID: 26312503 Free PMC article.
-
Plasticity of the myelination genomic fabric.Mol Genet Genomics. 2012 Mar;287(3):237-46. doi: 10.1007/s00438-012-0673-0. Epub 2012 Jan 13. Mol Genet Genomics. 2012. PMID: 22246408
References
-
- Lee C, Morton CC. Structural genomic variation and personalized medicine. N Engl J Med. 2008;358:740–741. - PubMed
Publication types
MeSH terms
Grants and funding
LinkOut - more resources
Full Text Sources
Molecular Biology Databases

