. 2011 Mar 29;6(3):e14786.
doi: 10.1371/journal.pone.0014786.

Discriminating multi-species populations in biofilms with peptide nucleic acid fluorescence in situ hybridization (PNA FISH)

Affiliations

Discriminating multi-species populations in biofilms with peptide nucleic acid fluorescence in situ hybridization (PNA FISH)

Carina Almeida et al. PLoS One. .

Erratum in

  • PLoS One. 2013;8(6). doi:10.1371/annotation/2b7e391f-b0cb-4d9f-8e90-85d080f8cbd4

Abstract

Background: Our current understanding of biofilms indicates that these structures are typically composed of many different microbial species. However, the lack of reliable techniques for the discrimination of each population has meant that studies focusing on multi-species biofilms are scarce and typically generate qualitative rather than quantitative data.

Methodology/principal findings: We employ peptide nucleic acid fluorescence in situ hybridization (PNA FISH) methods to quantify and visualize mixed biofilm populations. As a case study, we present the characterization of Salmonella enterica/Listeria monocytogenes/Escherichia coli single, dual and tri-species biofilms in seven different support materials. Ex-situ, we were able to monitor quantitatively the populations of ∼56 mixed species biofilms up to 48 h, regardless of the support material. In situ, a correct quantification remained more elusive, but a qualitative understanding of biofilm structure and composition is clearly possible by confocal laser scanning microscopy (CLSM) at least up to 192 h. Combining the data obtained from PNA FISH/CLSM with data from other established techniques and from calculated microbial parameters, we were able to develop a model for this tri-species biofilm. The higher growth rate and exopolymer production ability of E. coli probably led this microorganism to outcompete the other two [average cell numbers (cells/cm(2)) for 48 h biofilm: E. coli 2,1 × 10(8) (± 2,4 × 10(7)); L. monocytogenes 6,8 × 10(7) (± 9,4 × 10(6)); and S. enterica 1,4 × 10(6) (± 4,1 × 10(5))]. This overgrowth was confirmed by CSLM, with two well-defined layers being easily identified: the top one with E. coli, and the bottom one with mixed regions of L. monocytogenes and S. enterica.

Significance: While PNA FISH has been described previously for the qualitative study of biofilm populations, the present investigation demonstrates that it can also be used for the accurate quantification and spatial distribution of species in polymicrobial communities. Thus, it facilitates the understanding of interspecies interactions and how these are affected by changes in the surrounding environment.


Conflict of interest statement

Competing Interests: The authors have declared that no competing interests exist.

Figures

Figure 1
Figure 1. Epifluorescence microscopy pictures of a multiplex assay for mono-species and a three-species smear, using two PNA probes (SalPNA1873 and LmPNA1253) and DAPI staining.
In the columns we have the microscopy filter used to visualize each fluorochrome (from left to right, Alexa 594, Alexa 488 and DAPI). The first three rows present the pure smears for each species used. No cross-hybridization was observed between the two PNA probes. The fourth row shows a smear with the three species mixed. The bottom image represents the bands superposition discriminating the cells of the three populations.
Figure 2
Figure 2. PNA FISH validation for biofilm samples.
(A) Percentage of cells detected by PNA FISH for 24 and 48 h biofilms, in comparison with the total cells counts by DAPI. (B) Correlation between the PNA FISH counts and the DAPI counts for 24 and 48 h S. enterica e L. monocytogenes pure- culture biofilms. A high correlation between the two methods was observed and up to 48 hours at least 90% of the populations is detected by PNA FISH.
Figure 3
Figure 3. Biofilm formation for single- and dual-species biofilms.
On panel A it is possible observe the normalized areas for each biofilm on each adhesion material for cultivability, CV and PNA FISH/DAPI graphs (A). Panels B, C and D are shown as examples of CV, PNA FISH/DAPI and cultivability graphs, respectively, on the glass support. Similar graphs for the remaining supports are provided in the Figures S2, S3, S4 and S5.
Figure 4
Figure 4. Biofilm formation profiles for each species on single- and dual-species biofilms.
Cultivability (A) and PNA FISH/DAPI (B) areas showing the populations variations when co-cultured with a different species. (C) CV areas showing two typical CV profiles, the E. coli profile (at grey) suggesting a high production of exopolymers, and the L. monocytogenes and S. enterica profile (at pink) showing a reduced ability to produce exoplimers. The CV profile for E. coli/S. enterica biofilm suggests that Salmonella affected the E. coli ability to produce exopolymers.
Figure 5
Figure 5. Dual-species biofilms spatial organization for 48 h.
(A) Epifluorescence images showing an homogeneous distribution of the species. (B) CLSM transversal images showing that dual-species biofilms with E. coli presented two well defined layers. For Salmonella/Listeria biofim, it was not observed the formation of two layers.
Figure 6
Figure 6. Comparison between PNA FISH/DAPI and cultivability measurements.
Viable and cultivable bacteria adhered to the different material for S. enterica (AI) and L. monocytogenes (AII) pure culture biofilm and Salmonella/Listeria dual-especie biofilm (AII). Percentages of cells detected by cultivability for each specie, on single and dual-specie biofilm, adhered to copper (BII) and the remaining six material (BI- average values determined for the six materials together). Correlation between the PNA FISH counts and the CFU counts for 24 and 48 h biofilms (C) (all the 6 biofilm experiments included).
Figure 7
Figure 7. Tri-species biofilm formation.
(A) Biofilm populations for 24 and 48 hours on each support material. (B) CLSM images distinguishing each bacteria and the superposition of the three fields. (D) CLSM showing the biofilm three-dimensional spatial distribution. A frontal quadrant (red rectangle) was removed to show the existence of an upper layer exclusively formed by E. coli, over a mixed Salmonella and Listeria layer. The bottom blank rectangle shows a transversal biofilm image showing the well defined layers.
Figure 8
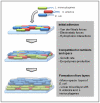
Figure 8. Schematic representation of the tri-species biofilm formation showing the main steps and the key factors involved on the two layers appearing.

Similar articles

Cited by

References

    1. Costerton JW, Cheng KJ, Geesey GG, Ladd TI, Nickel JC, et al. Bacterial Biofilms in Nature and Disease. Annual Review of Microbiology. 1987;41:435–464. - PubMed
    1. Mah TF, O'Toole GA. Mechanisms of biofilm resistance to antimicrobial agents. Trends Microbiol. 2001;9:34–39. - PubMed
    1. Hall-Stoodley L, Costerton JW, Stoodley P. Bacterial biofilms: From the natural environment to infectious diseases. Nature Reviews Microbiology. 2004;2:95–108. - PubMed
    1. Murray TS, Egan M, Kazmierczak BI. Pseudomonas aeruginosa chronic colonization in cystic fibrosis patients. Current Opinion in Pediatrics. 2007;19:83–88. - PubMed
    1. Parsek MR, Singh PK. Bacterial biofilms: An emerging link to disease pathogenesis. Annual Review of Microbiology. 2003;57:677–701. - PubMed

Publication types

MeSH terms

LinkOut - more resources