. 2012 Jan 1;130(1):29-39.
doi: 10.1002/ijc.25967. Epub 2011 Apr 8.

Expression of aldehyde dehydrogenase and CD133 defines ovarian cancer stem cells

Affiliations

Expression of aldehyde dehydrogenase and CD133 defines ovarian cancer stem cells

Ilona Kryczek et al. Int J Cancer. .

Abstract

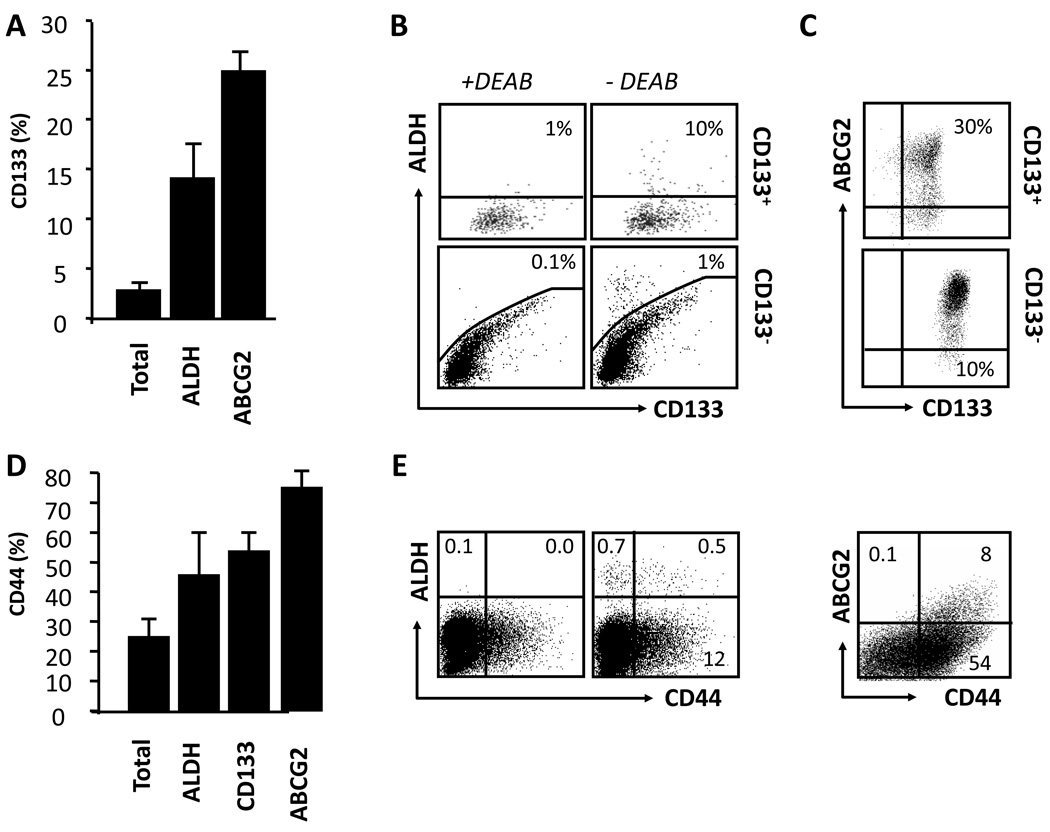
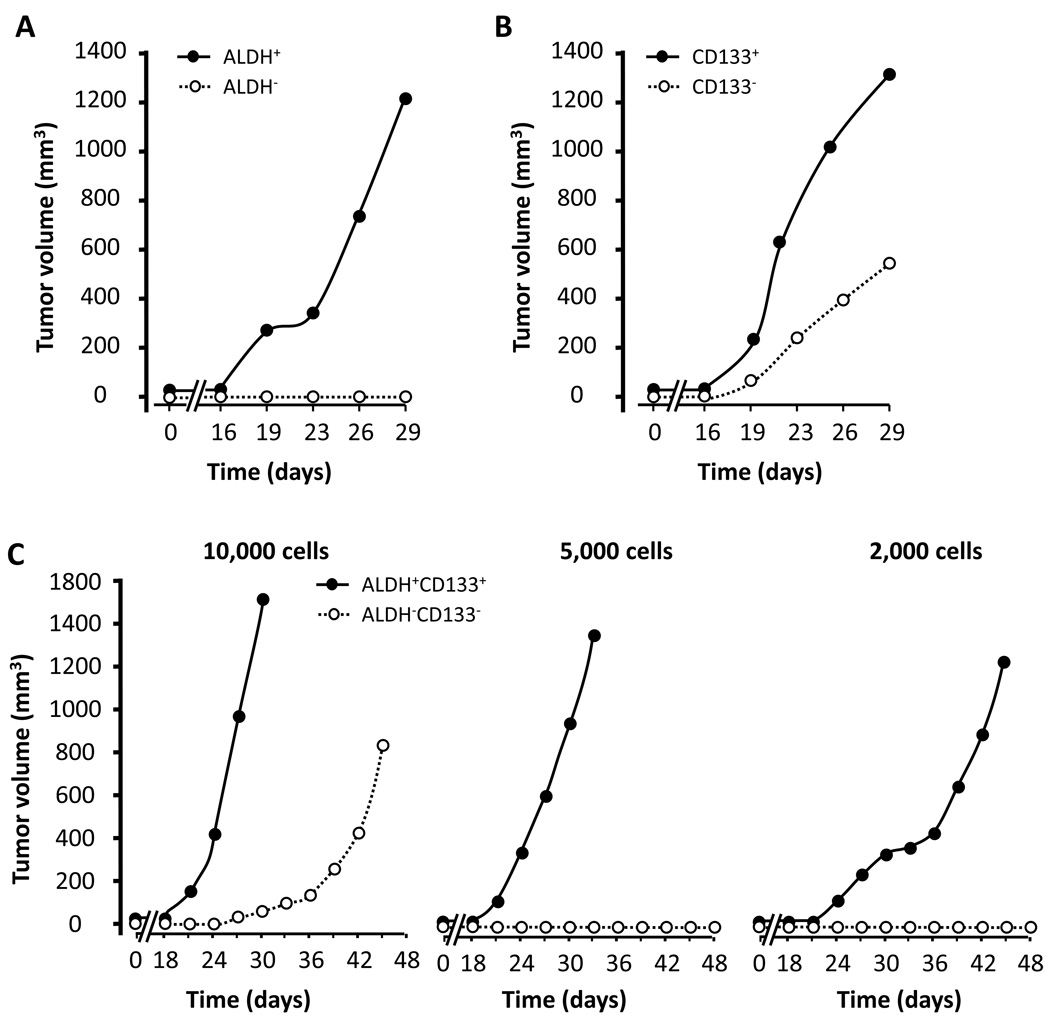
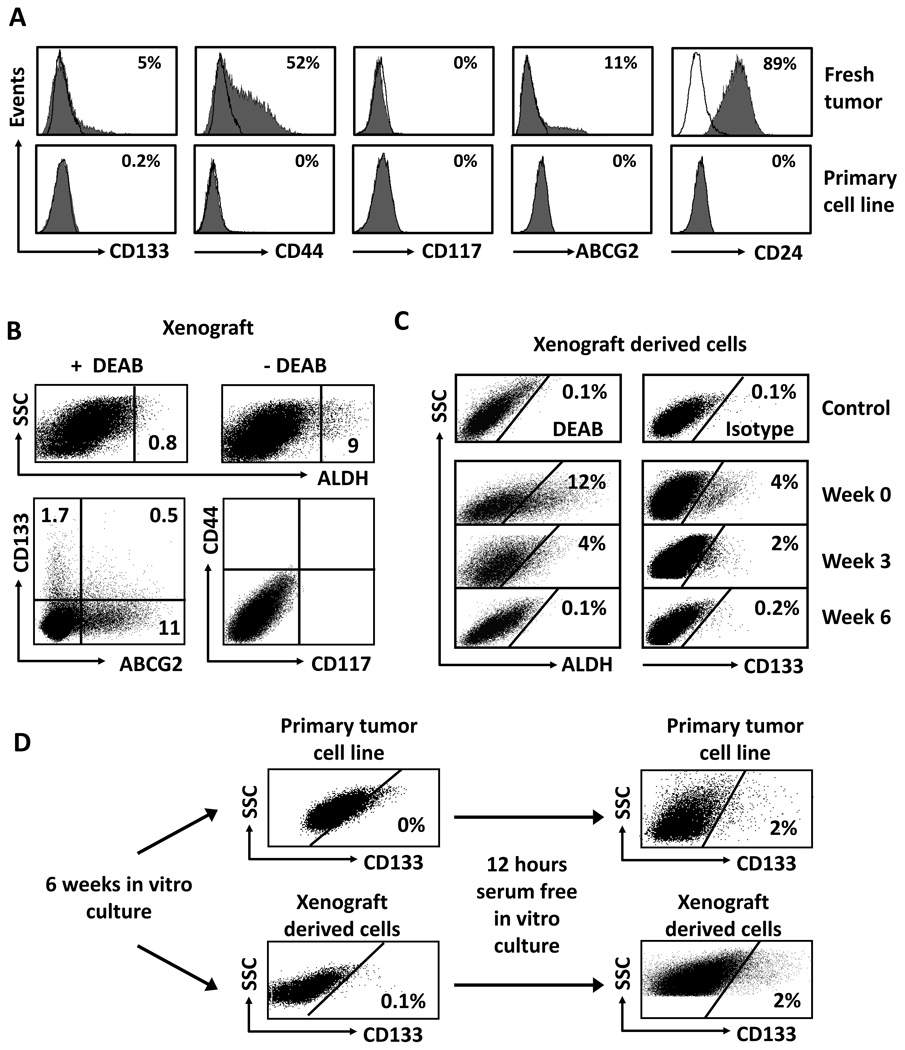
Identification of cancer stem cells is crucial for advancing cancer biology and therapy. Several markers including CD24, CD44, CD117, CD133, the G subfamily of ATP-binding cassette transporters (ABCG), epithelial specific antigen (ESA) and aldehyde dehydrogenase (ALDH) are used to identify and investigate human epithelial cancer stem cells in the literature. We have now systemically analyzed and compared the expression of these markers in fresh ovarian epithelial carcinomas. Although the expression levels of these markers were unexpectedly variable and partially overlapping in fresh ovarian cancer cells from different donors, we reliably detected important levels of CD133 and ALDH in the majority of fresh ovarian cancer. Furthermore, most of these stem cell markers including CD133 and ALDH were gradually lost following in vitro passage of primary tumor cells. However, the expression of ALDH and CD133, but not CD24, CD44 and CD117, could be partially rescued by the in vitro serum-free and sphere cultures and by the in vivo passage in the immune-deficient xenografts. ALDH+ and CD133+ cells formed three-dimensional spheres more efficiently than their negative counterparts. These sphere-forming cells expressed high levels of stem cell core gene transcripts and could be expanded and form additional spheres in long-term culture. ALDH+ , CD133+ and ALDH+ CD133+ cells from fresh tumors developed larger tumors more rapidly than their negative counterparts. This property was preserved in the xenografted tumors. Altogether, the data suggest that ALDH+ and CD133+ cells are enriched with ovarian cancer-initiating (stem) cells and that ALDH and CD133 may be widely used as reliable markers to investigate ovarian cancer stem cell biology.


Conflict of interest statement

Funding Disclosure

We have no financial conflict of interest.

Figures

Figure 1
Figure 1. Cancer stem cell markers in fresh ovarian cancer
Fresh ovarian tumors were separated into single cell suspensions. Cells were stained for lineage specific and cancer stem cell markers and apoptotic cells. (a) Phenotype of fresh ovarian cancer cells. Multiple color FACS analysis was performed on the cells by gating on viable linCD45CD34 cells. Epithelial ovarian cancer cells were defined as viable linCD45CD34ESA+ cells. The characteristics of linCD45CD34ESA+ cells in Forward scatter (FSC)/Side scatter (SSC) are shown. One of 25 representative patients is shown. (b, c) Cancer stem cell markers in fresh ovarian cancer cells. Results are expressed as the percentage of specific population in linCD45CD34ESA+ cells (b, c). Original dot plots showed high (upper panel) and low (lower panel) expression of given cancer stem cell marker in fresh ovarian cancer cells (c). (d, e) the expression of CD133 and ESA in fresh ovarian cancer tissues. High levels of CD133 (d), and low levels of CD133 (e).
Figure 2
Figure 2. Relationships between multiple cancer stem cell markers in fresh ovarian cancer
Fresh ovarian tumors were separated into single cell suspensions. Cells were stained for stem cell markers (CD133, ALDH, ABCG2 and CD44) and linkage markers (CD45, CD34 and ESA). Tumor cells were determined as described in figure 1a. (a–c) The phenotypic characteristics of CD133+ tumor cell populations. Results are shown as the percentage of CD133+ cells in different tumor populations. Original dot plots showed the relationship between ALDH, ABCG2and CD133 (b, c). As a control for ALDH activity, the DEAB inhibitor has been used (see Materials and methods) (b). (d, e) The phenotypic characteristic of CD44+ tumor cells. Results are shown as the percentage of CD44+ cells in different tumor populations. Original dot plots showed the relationship between ALDH and ABCG2. n = 12. DEAB, specific ALDH inhibitor diethylaminobenzaldehyde.
Figure 3
Figure 3. In vivo tumorigenicity of ALDH+, CD133+ and ALDH+CD133+ cells
(a, b), In vivo tumor formation. 2000 ALDH+ and ALDH cells (a), 2000 CD133+ and CD133 cells (b), and 2000–10,000 ALDH+CD133+ cells, and ALDHCD133 cells were electronically sorted from fresh ovarian tumors and injected into NSG mice (n = 5). Tumor volumes were measured. Cells in a and b were from one donor. Cells in c were from a different donor. One of 3 independent experiments is shown.
Figure 4
Figure 4. Sphere formation of ALDH+, CD133+ and ALDH+CD133+ cells
(a, b) Sphere forming ovarian cancer cells were enriched in bulk ALDH+ and CD133+ cells. The sphere forming assay was performed with bulk ovarian cancer cells, and cells depleted for CD133 and/or ALDH. Numbers of spheres were expressed as Mean ± SEM, n = 4, derived from 3 different patients. (c) The sphere forming ovarian cancer cells were enriched in sorted primary ALDH+, CD133+ and ALDH+CD133+ cells. The sphere forming assay was performed with sorted ALDH+, CD133+, ALDH+CD133+ and total cells. Numbers of spheres were expressed as Mean ± SEM, n = 4, derived from 3 different patients. (d) Different morphological appearance of spheres and sphere expansion from different patients. Different sphere appearances were observed from different patients (type A, upper panel, and type B, lower panel). Primary sphere cells formed additional spheres in the long-term culture. Results were shown from two patients. (e) High levels of stem cell core gene transcripts in sphere cells. Real-time PCR was conducted with parental cells and sphere forming cells for stem cell core genes. Results are expressed as the mean values relative to GAPDH ± SD. Three experiments with triplicates, P < 0.01.
Figure 5
Figure 5. Cancer stem cell markers in fresh, primary and xenografted ovarian tumor cells
(a) Cancer stem cell markers in fresh and primary ovarian cancer cell lines. Fresh tumor cells were directly isolated fresh ovarian cancer ascites or tumor tissues. The cells were cultured for 3–6 weeks in conventional culture medium (10% Fcs). The expression of cancer stem cells was determined by FACS. Results were expressed as the percentage of certain stem cell marker positive cells. One of 6 experiments is shown. (b) Cancer stem cell markers in xenograft-derived ovarian cancer cell lines. 5 × 10⁶ cells from the culture of primary ovarian cancer cell lines were injected into NSG mouse to form tumor. Xenograft-derived tumor cells were stained for stem cell markers. Results were expressed as the percent of positive cells in total tumor cells. Human tumor cells in the xenografts were determined by gating on H-2Kb-7-AAD cells. (c) Cancer stem cell markers in the cultured xenograft-derived ovarian cancer cell lines in conventional culture. Human tumor cells in the xenografts were obtained from xenografts as described (b). The cells were cultured with 10% Fcs from 0–6 weeks. The cultured Xenograft-derived tumor cells were stained for stem cell markers. Results were expressed as the percent of positive cells in total tumor cells. (d). Cancer stem cell markers in the cultured primary and xenograft-derived ovarian cancer cell lines in serum free condition. Primary tumor cells were cultured for 6 weeks in conventional condition (upper panel), and subsequently subject to serum-free culture for 12 hours (upper panel). The cells were stained for stem cell markers. Results were expressed as the percent of positive cells in total tumor cells. Similar experiments were realized with xenograft-derived tumor cells. One of 5 is shown (b–d).

References

    1. Zou W. Immunosuppressive networks in the tumour environment and their therapeutic relevance. Nat Rev Cancer. 2005;5:263–274. - PubMed
    1. Zou W. Regulatory T cells, tumour immunity and immunotherapy. Nat Rev Immunol. 2006;6:295–307. - PubMed
    1. Zou W, Chen L. Inhibitory B7-family molecules in the tumour microenvironment. Nat Rev Immunol. 2008;8:467–477. - PubMed
    1. Zou W, Restifo NP. T(H)17 cells in tumour immunity and immunotherapy. Nat Rev Immunol. 2010;10:248–256. - PMC - PubMed
    1. Reya T, Morrison SJ, Clarke MF, Weissman IL. Stem cells, cancer, and cancer stem cells. Nature. 2001;414:105–111. - PubMed

Publication types

MeSH terms