. 2011 Apr 12;19(4):527-40.
doi: 10.1016/j.ccr.2011.02.017.

A tight junction-associated Merlin-angiomotin complex mediates Merlin's regulation of mitogenic signaling and tumor suppressive functions

Affiliations

A tight junction-associated Merlin-angiomotin complex mediates Merlin's regulation of mitogenic signaling and tumor suppressive functions

Chunling Yi et al. Cancer Cell. .

Abstract

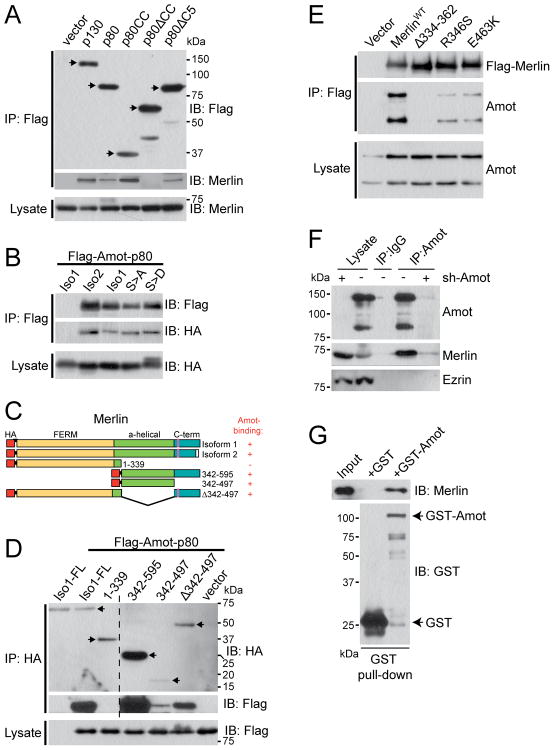
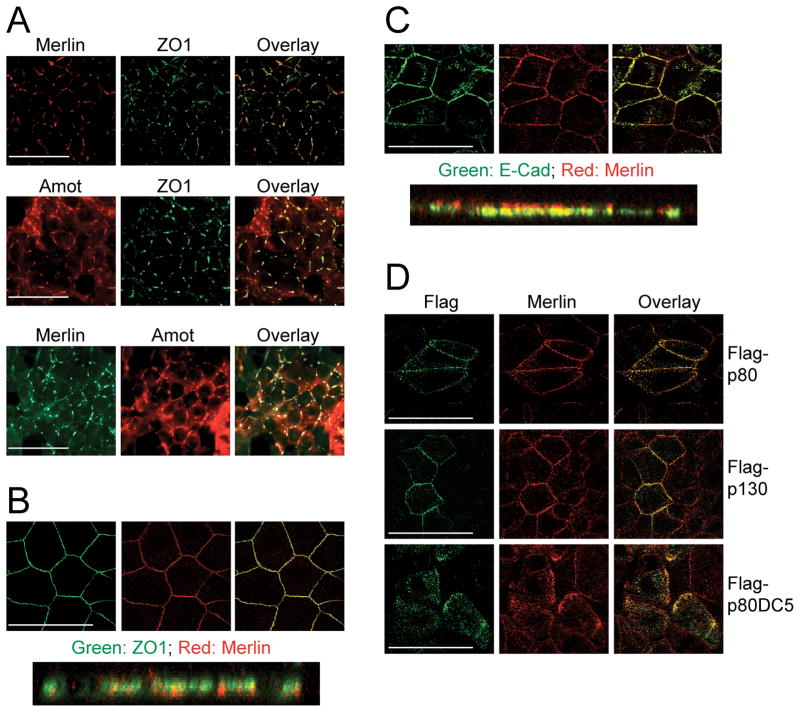
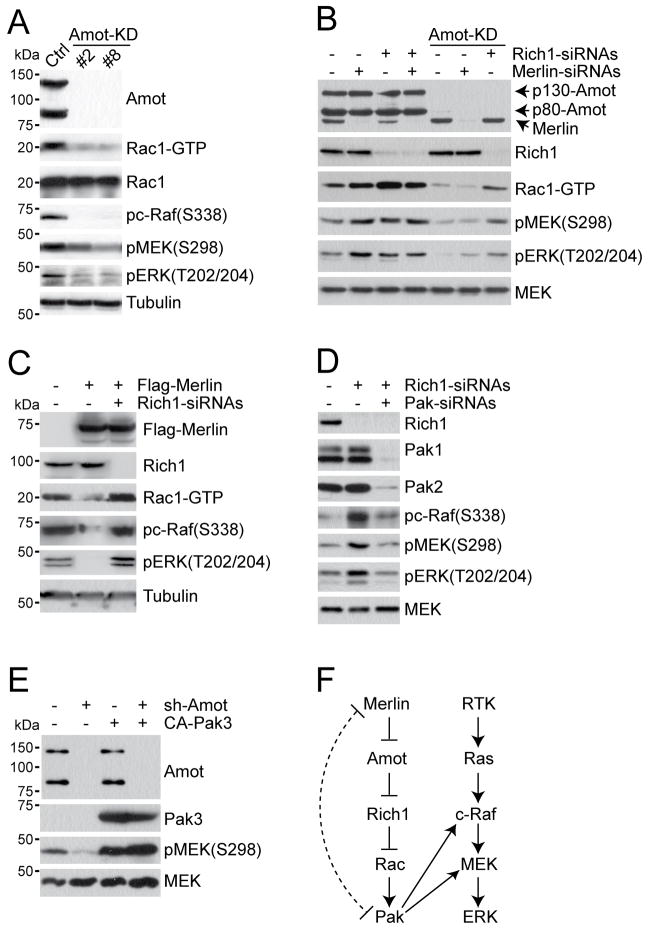
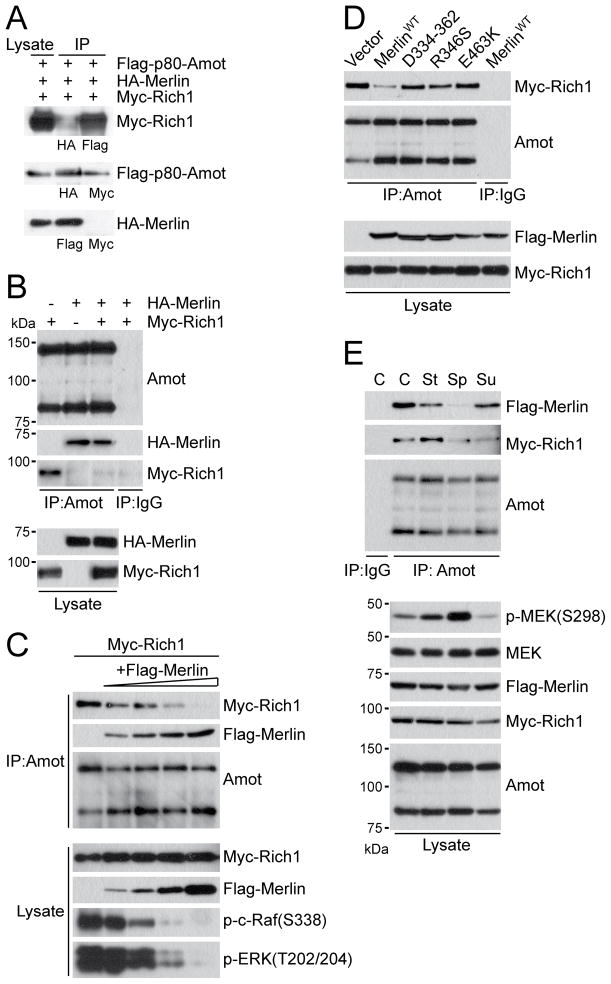
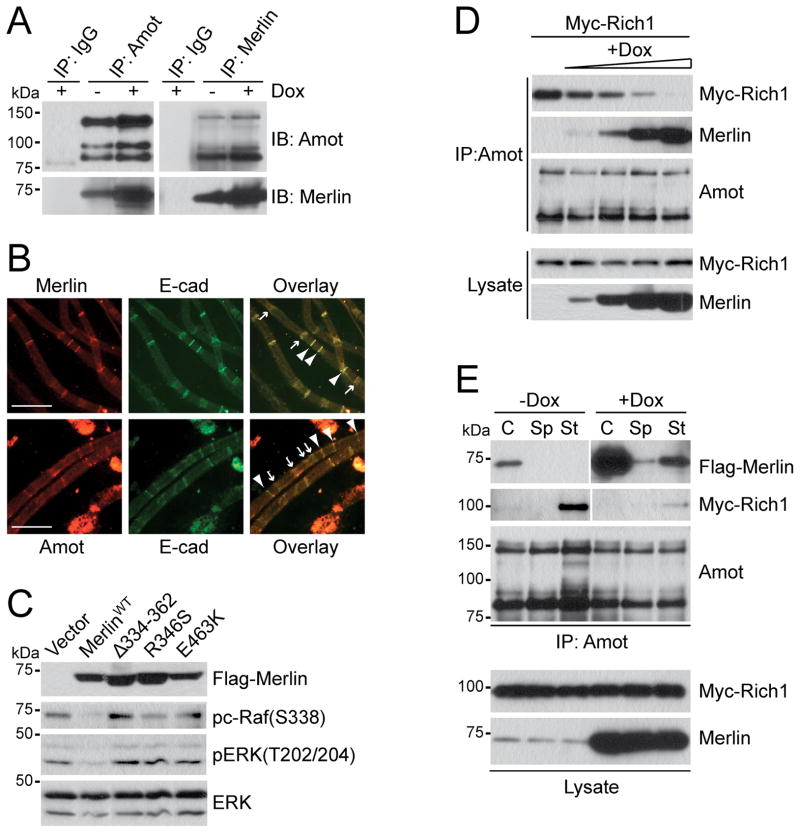
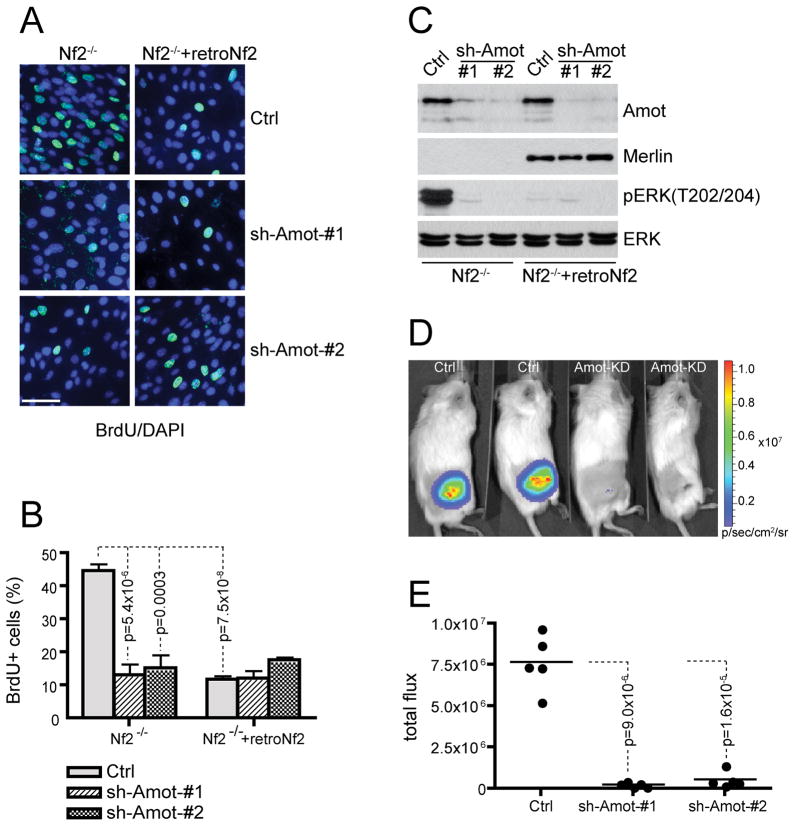
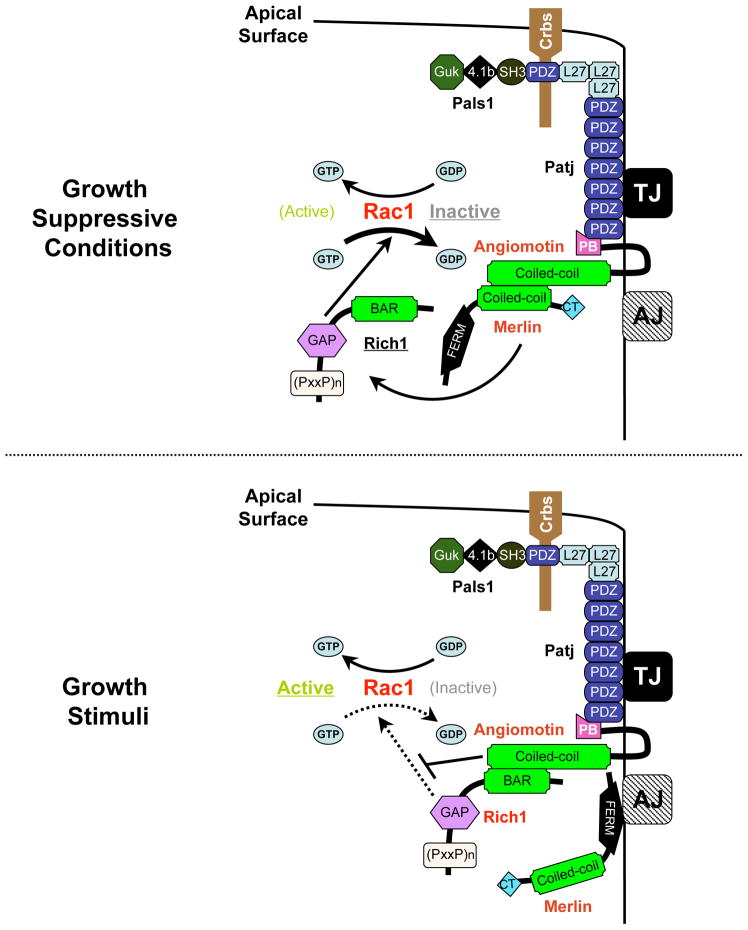
The Merlin/NF2 tumor suppressor restrains cell growth and tumorigenesis by controlling contact-dependent inhibition of proliferation. We have identified a tight-junction-associated protein complex comprising Merlin, Angiomotin, Patj, and Pals1. We demonstrate that Angiomotin functions downstream of Merlin and upstream of Rich1, a small GTPase Activating Protein, as a positive regulator of Rac1. Merlin, through competitive binding to Angiomotin, releases Rich1 from the Angiomotin-inhibitory complex, allowing Rich1 to inactivate Rac1, ultimately leading to attenuation of Rac1 and Ras-MAPK pathways. Patient-derived Merlin mutants show diminished binding capacities to Angiomotin and are unable to dissociate Rich1 from Angiomotin or inhibit MAPK signaling. Depletion of Angiomotin in Nf2(-/-) Schwann cells attenuates the Ras-MAPK signaling pathway, impedes cellular proliferation in vitro and tumorigenesis in vivo.


Figures

Figure 1
Figure 1. Merlin interacts with Angiomotin through their mutual CC domains
(A) Immunoblot (IB) analysis with Flag and Merlin antibodies of Flag Immunoprecipitates (IP) and total cell lysate from HEK293 cells transfected with various Flag-tagged Amot constructs as indicated. (B) IB analysis with Flag and HA antibodies of Flag-IP and total cell lysate from HEK293 cells co-transfected with Flag-Amot-p80 and HA-tagged Merlin of either isoform (Iso1 or Iso2), or S518A (S>A) and S518D (S>D) mutants as indicated. (C) Diagram of HA-tagged (represented by red bars) full-length Merlin and deletion constructs used in panel D below. S518 phosphorylation site is marked by a purple line. The N-terminal FERM domain is represented in yellow, the α-helical region in green, and the C-terminal domain (C-term) in blue. The Amot-binding status of each construct is indicated by “+” (binding) or “−” (no binding). (D) IB analysis with HA and Flag antibodies of HA-IP and total cell lysate of HEK293 cells co-tranfected with Flag-Amot-p80 and various HA-tagged Merlin constructs as indicated. Hatched line indicates the merge of lanes from the same images of the same experiment/blot with an irrelevant intervening lane deleted. (E) IB analysis with Merlin and Amot antibodies of Flag-IP and total cell lysate from HEK293 cells transfected with Flag-tagged wild-type (WT) or patient-derived mutant Merlin alleles as indicated. (F) IB analysis with Amot, Merlin and Ezrin antibodies of total cell lysate or IP with Amot antibody or control IgG from HEK293 cells expressing control (−) or sh-Amot (+). (G) IB analysis with Merlin and GST antibodies of GST pull-down of recombinant GST or GST-Amot-p80 proteins incubated with recombinant His-Merlin. See also Figure S1.
Figure 2
Figure 2. Merlin co-localizes with Angiomotin to AJs and TJs in epithelial cells
(A) Immunofluorescence (IF) analysis of endogenous Merlin and ZO1 (upper panel), Amot and ZO1 (middle panel), or Merlin and Amot (lower panel) in HEK293 cells. Images were taken at 40X magnification. (B and C) IF analysis of the endogenous localization of (B) Merlin (red) and ZO1 (green) or (C) Merlin (red) and E-Cad (green) in confluent MDCK cells. Confocal images (upper panels) were taken at 100X magnification. Deconvoluted Z-stacking images shown in lower panels. (D) IF analysis of MDCK cells transfected with Flag-p80, Flag-p80ΔC5 or Flag-p130 with Flag and Merlin antibodies. Confocal images were taken at 100X magnification. Scale bars = 50 μm. See also Figure S2.
Figure 3
Figure 3. Merlin functions through Angiomotin and Rich1 to inhibit Rac1 and Ras-MAPK signaling
(A) IB analysis of cell lysates from HEK293 cells stably expressing vector control (Ctrl) or two independent Angiomotin shRNAs (Amot-KD) with different antibodies as indicated. Tubulin used as internal loading control. (B) IB analysis of cell lysate from HEK293 cells stably expressing vector control (Ctrl) or Angiomotin shRNAs (Amot-KD, clone #8) that were transfected with non-silencing control siRNAs (−) or siRNAs targeting Merlin or Rich1 (+). Total MEK protein used as internal loading control. (C) IB analysis of cell lysate from HEK293 cells transiently transfected with Flag-Merlin with (+) or without (−) siRNAs targeting Rich1. Tubulin used as internal loading control. (D) IB analysis of cell lysate from HEK293 cells transiently transfected with non-silencing control siRNAs (−) or siRNAs targeting Rich1 or Pak (+). Total MEK used as internal loading control. (E) IB analysis of cell lysate from HEK293 cells stably expressing vector control (Ctrl) or Angiomotin shRNAs (Amot-KD, clone #8) that were transfected with empty vector (−) or constitutive-active form of Pak3 (+). Total MEK used as internal loading control. Cells were serum starved overnight and stimulated with 10 ng/mL EGF for 5′ in (A-E). Data shown are representative of 3 independent experiments. (F) Schematic representation of the Merlin-Angiomotin-Rich1-Rac1-Pak signaling cascade in relation to the Ras-ERK pathway. The dotted curved line reflects previous findings showing that Merlin can also directly inhibit Pak activity and in a negative feedback loop, Pak phosphorylates and inactivates Merlin. See also Figure S3.
Figure 4
Figure 4. Merlin competes with Rich1 for association with Angiomotin
(A) IP and IB analysis of cell lysates from HEK293 cells co-transfected with HA-Merlin, Flag-Amot-p80 and Myc-Rich1 with HA, Flag, or Myc antibodies as indicated. (B) IB analysis of endogenous Angiomotin IP from HEK293 cells expressing equal amount of HA-Merlin and Myc-Rich1 alone or in combination. Normal rabbit IgG used as negative control. (C) IB analysis of Myc-Rich1 and Flag-Merlin co-precipitated with endogenous Angiomotin or and total cell lysates from HEK293 cells expressing fixed amount of Myc-Rich1 (10μg) and incremental amount of Flag-Merlin (0, 1, 2.5, 5 and 10μg from left to right) with antibodies as indicated. (D) IB analysis of Myc-Rich1 and Flag-Merlin co-precipitated with endogenous Angiomotin and total cell lysate from HEK293 cells expressing Myc-Rich1 alone or in combination with Flag-tagged wild type or mutant Merlin alleles as indicated. Normal rabbit IgG used as negative control. (E) IB analysis with indicated antibodies of Angiomotin IP and total cell lysate from HEK293 cells co-expressing Flag-Merlin and Myc-Rich1 under confluent (C), sparse (Sp), serum-stimulated (St), or suspension (Su) conditions. Normal rabbit IgG used as negative control. Total MEK used as internal loading control. See also Figure S4.
Figure 5
Figure 5. Merlin interacts and co-localizes with Angiomotin in schwannoma cells and myelinating peripheral nerves
(A) IP and IB analysis with Amot or Merlin antibodies of cell lysates from untreated (−) or Doxycyline induced (+) RT4-67 cells as indicated. (B) IF analysis of teased nerve fibers isolated from mouse sciatic nerves for Amot and E-cadherin (E-cad), or Merlin and E-cad as indicated. Arrowheads indicate the Schmidt-Lantermann incisures and paranodes. Images were taken at 40X magnification. Scale bar = 50 μm. (C) IB analysis of Raf and ERK activation in cell lysates from RT4 cells transfected with vector control or Flag-tagged wild type or mutant Merlin as indicated. (D) IB analysis of Myc-Rich1 and Merlin co-precipitated with endogenous Angiomotin and total cell lysates from RT4-67 cells expressing fixed amount of Myc-Rich1 (10μg) and treated with increasing dose of Doxycyline (0, 50, 100, 250 and 500 ng/ml from left to right) as indicated. (E) IB analysis with indicated antibodies of Angiomotin IP or total cell lysate from untreated (−Dox) or Doxycyline induced (+Dox) RT4-67 transfected with Myc-Rich1 and grown under confluent (C), sparse (Sp), or serum-stimulated (St) conditions. See also Figure S4.
Figure 6
Figure 6. Angiomotin knockdown inhibits the proliferation and tumorigenicity of Nf2−/− Schwann cells
(A) Representative fields of BrdU (green) and DAPI (blue) double staining of Nf2−/− SC4 cells or Merlin-reconstituted SC4 cells (Nf2−/−+retroNf2) infected with control (Ctrl) or Angiomotin shRNAs (sh-Amot #1 or #2). Cells were serum starved for 24 hours followed by incubation with BrdU in the presence of serum for 18 hours. Images were taken at 40X magnification. Scale bar = 50 μm. (B) Quantitative analysis of the percentage of BrdU positive cells from (A). Each bar represents the average percentage of BrdU+ cells of 5 random fields from each cell line. Error bars indicate standard deviation (SD). p value was calculated with 2-tailed unpaired Student’s t test. (C) IB analysis of ERK activation in Nf2−/− SC4 cells or Merlin-reconstituted SC4 cells (Nf2−/−+retroNf2) infected with control (Ctrl) or Angiomotin shRNAs (sh-Amot #1 or #2). Total ERK used as internal loading control. (D) Representative images from bioluminescence imaging (BLI) of orthotopic tumors derived from control SC4/pLuc-mCherry cells (Ctrl) or Amot-KD SC4/pLuc-mCherry (Amot-KD) cells injected into sciatic nerve sheaths of NOD/SCID mice. (E) Quantitative analysis of the total flux of luciferase signal from areas of injection. The sciatic nerves of three groups (N=5) of NOD/SCID mice were injected intraneurally with 2×10⁵ Ctrl SC4/pLuc-mCherry or Amot-KD SC4/pLuc-mCherry cells (line #1 or line #2). All mice were imaged by BLI one week after the surgery. p value was calculated with 2-tailed unpaired Student’s t test. See also Figure S5.
Figure 7
Figure 7. Merlin inhibits Rac1 activity by releasing Rich1 from its TJ-associated inhibitor, Angiomotin
A model depicting the proposed mechanism of how the differential interactions between Merlin, Angiomotin and Rich1 modulate Rac1 activity. Under growth suppressive conditions, Merlin binds to Angiomotin, releasing Rich1 to inactivate Rac1 by converting Rac1-GTP to Rac1-GDP. In response to growth stimuli, Merlin dissociates from Angiomotin. Unoccupied Angiomotin binds to and blocks Rich1’s GAP activity, leading to increased levels of Rac1-GTP.

References

    1. Alfthan K, Heiska L, Gronholm M, Renkema GH, Carpen O. Cyclic AMP-dependent protein kinase phosphorylates merlin at serine 518 independently of p21-activated kinase and promotes merlin-ezrin heterodimerization. J Biol Chem. 2004;279:18559–18566. - PubMed
    1. Ammoun S, Flaiz C, Ristic N, Schuldt J, Hanemann CO. Dissecting and targeting the growth factor-dependent and growth factor-independent extracellular signal-regulated kinase pathway in human schwannoma. Cancer Res. 2008;68:5236–5245. - PubMed
    1. Beeser A, Jaffer ZM, Hofmann C, Chernoff J. Role of group A p21-activated kinases in activation of extracellular-regulated kinase by growth factors. J Biol Chem. 2005;280:36609–36615. - PubMed
    1. Benhamouche S, Curto M, Saotome I, Gladden AB, Liu CH, Giovannini M, McClatchey AI. Nf2/Merlin controls progenitor homeostasis and tumorigenesis in the liver. Genes Dev. 2010;24:1718–1730. - PMC - PubMed
    1. Curto M, Cole BK, Lallemand D, Liu CH, McClatchey AI. Contact-dependent inhibition of EGFR signaling by Nf2/Merlin. J Cell Biol. 2007;177:893–903. - PMC - PubMed

Publication types

MeSH terms