. 2011 Apr 12;19(4):541-55.
doi: 10.1016/j.ccr.2011.02.006.

CCL18 from tumor-associated macrophages promotes breast cancer metastasis via PITPNM3

Affiliations

CCL18 from tumor-associated macrophages promotes breast cancer metastasis via PITPNM3

Jingqi Chen et al. Cancer Cell. .

Erratum in

  • Cancer Cell. 2011 Jun 14;19(6):814-6

Abstract

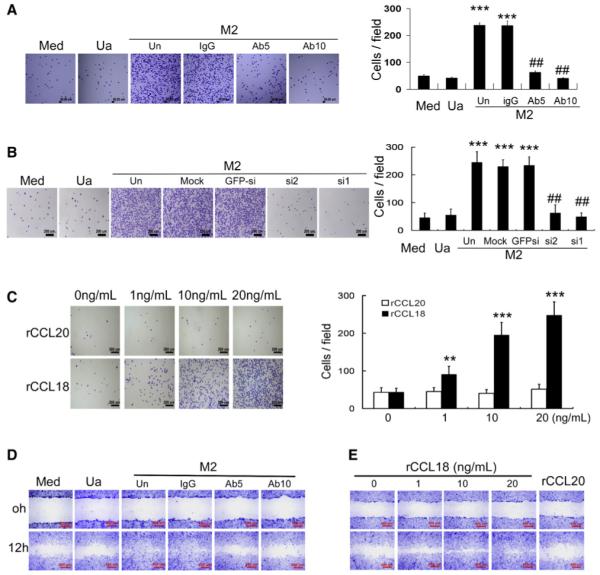
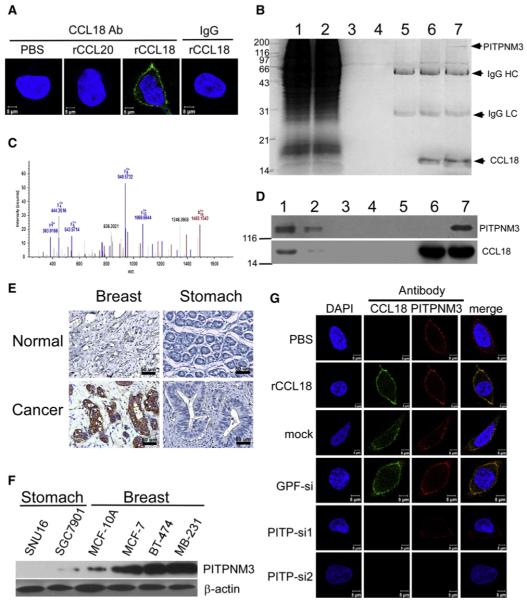
Tumor-associated macrophages (TAMs) can influence cancer progression and metastasis, but the mechanism remains unclear. Here, we show that breast TAMs abundantly produce CCL18, and its expression in blood or cancer stroma is associated with metastasis and reduced patient survival. CCL18 released by breast TAMs promotes the invasiveness of cancer cells by triggering integrin clustering and enhancing their adherence to extracellular matrix. Furthermore, we identify PITPNM3 as a functional receptor for CCL18 that mediates CCL18 effect and activates intracellular calcium signaling. CCL18 promotes the invasion and metastasis of breast cancer xenografts, whereas suppressing PITPNM3 abrogates these effects. These findings indicate that CCL18 derived from TAMs plays a critical role in promoting breast cancer metastasis via its receptor, PITPNM3.


Figures

Figure 1
Figure 1. Breast TAMs Constitutively Express CCL18
(A) The ratio of a panel of cytokine mRNA in TAMs versus PBMs from patients with breast cancer and IL-4-activated MDMs versus unactivated MDMs from healthy donors, as assayed by qRT-PCR. (B) The ratio of CCL18 mRNA in TAMs versus PBMs from patients with breast cancer (n = 33) with or without axillary lymph node metastasis, as determined by qRT-PCR (left). Each bar corresponds to mean ± standard deviation (SD) of each individual patient. Representative western blotting for CCL18 in TAMs and PBMs from patients with breast cancer with or without axillary lymph node metastasis (right). β-Actin was used as a loading control. (C) Immunohistochemical staining of CCL18 in benign cystic fibrosis of the breast, atypical hyperplasia, breast carcinoma in situ, and invasive breast carcinoma. (D) Serum CCL18 level in the patients with benign breast diseases and invasive breast carcinomas with or without axillary lymph node or distal metastasis, as determined by ELISA. Bars correspond to mean ± SD. (E) Kaplan-Meier survival curve of patients with breast cancer with lower (≤20 per view of field, n = 405) and higher CCL18-positive TAM counts (>20 per view of field, n = 157; p < 0.001) with a median follow-up period of 45 months. The number of survived patients stratified to the follow-up periods is indicated below the graph. See also Figure S1.
Figure 2
Figure 2. Breast TAMs and IL-4-Activated MDMs Promote the Invasion of Breast Cancer Cells via CCL18
(A) Boyden chamber assay for MDA-MB-231 cells plated on the upper cell culture inserts, with culture medium alone (Med), unactivated (Ua), LPS-activated (M1), or IL-4-activated MDMs (M2) plated in the lower chambers in the presence or absence of an anti-CCL18 antibody at 5 or 10 μg/ml, or an isotype-matched IgG control (IgG). (B) Similar to (A), MDA-MB-231 cells or primary breast cancer cells were cocultured with PBMs or TAMs from patients with breast cancer plated. (C) Similar to (A), MDA-MB-231 cells were cocultured with unactivated (Ua) MDMs or IL-4-activated MDMs (M2) that were untreated (Un), mock transfected, or transfected with either of the two CCL18-siRNAs or GFP-siRNA. (D) Boyden chamber assay for MDA-MB-231 cells with rCCL18 at increasing concentrations (1–20 ng/ml) or rCCL20 at 20 ng/ml added to culture medium in the lower chambers. Bars correspond to mean ± SD. **p < 0.01 and ***p < 0.001 as compared with the cells treated with medium alone, whereas ## p < 0.01 as compared with the untreated cells cocultured with M2 MDMs or TAMs. See also Figure S2.
Figure 3
Figure 3. IL-4-Activated MDMs Promote Fibronectin Adherence and Migration of Breast Cancer Cells via CCL18
(A) Adherence assays for MDA-MB-231 cells suspended in serum-free medium in the lower wells of the Boyden chambers coated with fibronectin, with or without (Med) unactivated (Ua) or IL-4-activated MDMs (M2) plated on the inserts in the presence or absence of an anti-CCL18 antibody at 5 μg/ml (Ab5) or 10 μg/ml (Ab10), or an isotype-matched IgG control (IgG). (B) Similar to (A), MDA-MB-231 cells were cocultured with unactivated (Ua) or IL-4-activated MDMs (M2) that were untransfected (Un), mock transfected, or transfected with either of the two CCL18-siRNAs (si1 and si2) or GFP-siRNA. (C) MDA-MB-231 cells were suspended in serum-free medium and allowed to adhere to culture plate coated with fibronectin in the presence or absence of rCCL18 and rCCL20 at increasing concentrations (1–20 ng/ml). Bars correspond to mean ± SD. **p < 0.01 and ***p < 0.001 as compared with the cells treated with medium alone, whereas ## p < 0.01 as compared with the untreated cells cocultured with M2 MDMs. (D) Wound-healing assay for MDA-MB-231 cells plated in the lower Boyden chambers, with unactivated (Ua) or IL-4-activated MDMs (M2) seeded on cell culture inserts in the presence or absence (Un) of an anti-CCL18 antibody at 5 μg/ml (Ab5) or 10 μg/ml (Ab10), or an isotype-matched IgG control (IgG). (E) Wound-healing assay for MDA-MB-231 cells in the presence or absence of rCCL18 at increasing concentration (1–20 ng/ml) or rCCL20 at 20 ng/ml. See also Figure S3.
Figure 4
Figure 4. CCL18 Binds to PITPNM3 on Breast Cancer Cell Membrane
(A) Confocal microscopy for MDA-MB-231 cells treated with PBS, rCCL20, or rCCL18 at 20 ng/ml at 4°C, then fixed and stained with an Alexa 488-labeled anti-CCL18 antibody. An isotype-matched IgG (IgG) was used as a control, and cell nuclei were counterstained with DAPI. (B) Immunoprecipitation of the membrane extracts (ME) from rCCL18-treated MDA-MB-231 cells with anti-CCL18 antibody. Lane 1 shows input of ME (5%), lane 2 flowthrough (5%), lane 3 ME from the PBS-treated cells incubated with uncoupled protein A/G beads, lane 4 ME from rCCL18-treated cells incubated with uncoupled beads, lane 5 ME from PBS-treated cells incubated with antibody-coupled beads, lane 6 SDS-treated ME from rCCL18-treated cells incubated with antibody-coupled beads, and lane 7 ME from rCCL18-treated cells incubated with antibody-coupled beads. IgG HC, IgG heavy chain; IgG LC, IgG light chain. (C) Mass spectra of a representative peptide fragment from the protein band indicated by an arrow in lane 7 of (B). (D) Western blot validation of mass spectrometric identification using an anti-PITPNM3 antibody (upper) and an anti-CCL18 antibody (lower). All lanes and conditions are described as in (B). (E) Immunohistochemistry for PITPNM3 expression in breast and gastric carcinomas, as well as normal breast and gastric tissues in paraffin tissue sections. (F) Western blotting for PITPNM3 expression in gastric cancer cell lines of SGC7901 and SNU16, breast epithelial MCF-10A line, and breast cancer cell lines of MCF-7, BT-474, and MDA-MB-231. β-Actin was used as a loading control. (G) Confocal microscopy for MDA-MB-231 cells stained with an Alexa 488-labeled anti-CCL18 antibody and a Cy3-labeled anti-PITPNM3 antibody. The cells were treated with PBS (row 1) or recombinant CCL18 (rCCL18) at 20 ng/ml (rows 2–6) for 3 hr at 4°C, and were untransfected (row 2), mock transfected (row 3), transfected with GFP-siRNA (row 4), or either of the two PITPNM3-siRNAs (rows 5 and 6). Cell nuclei were counterstained with DAPI. See also Figure S4.
Figure 5
Figure 5. CCL18 Induces Functional Response in PITPNM3 Expressing HEK293 Cells
(A) Mobilization of [Ca2+]i in HEK293 cells that were stably transfected with pcDNA3-PITPNM3 (PITPNM3), pcDNA3 vector alone (vector), or untransfected and were treated with HBSS, rCCL18, or rCCL20 at 40 ng/ml. (B) Western blotting for the phosphorylated and total proteins of PLCγ1, PKCζ, and IP3KB in HEK293 cells that were transfected or treated as in (A). Thapsigargin (TG), a calcium channel agonist, was used as a positive control for calcium signaling. (C) Binding assay with 60,000 cpm of 125I-CCL18 in the presence or absence of increasing concentrations of unlabeled rCCL3, rCCL4, rCCL2, rCCL18, or rCCL20 for HEK293 cells that were transfected as in (A). (D) Confocal microscopy for HEK293 cells stained with an Alexa 488-labeled anti-CCL18 antibody and a Cy3-labeled PITPNM3 antibody. The cells were transfected as in (A) and treated with PBS or rCCL18 at 40 ng/ml. (E and F) Boyden chamber assays for HEK293 cells transfected as in (A) and treated with increasing concentrations of rCCL18 or rCCL20 at 40 ng/ml added to culture medium in the lower chambers (E), or added to culture medium in the upper chambers in the presence of rCCL18 at 20 ng/ml in the lower ones (F). Bars correspond to mean ± SD. **p < 0.01 and ***p < 0.001 as compared with the cells treated in the absence of rCCL18 in the lower (E) or the upper (F) chambers. See also Figure S5.
Figure 6
Figure 6. CCL18 Enhances Fibronectin Adherence and Invasiveness of Breast Epithelial Cells via Interacting with PITPNM3
(A) Adherence assay for MDA-MB-231 cells that were mock transfected, or transfected with GFP-siRNA or either of the PITPNM3-siRNAs, and were treated with PBS or rCCL18 at 20 ng/ml. (B) Boyden chamber assay for the MDA-MB-231 cells that were treated as in (A). Bars correspond to mean ± SD. ***p < 0.001 versus untransfected control (Un). (C) Western blotting of MDA-MB-231 cells treated with PBS, rCCL20, or rCCL18 with or without transfection of GFP-siRNA or either of the PITPNM3-siRNAs for the expression of the phosphorylated and total proteins of Pyk2, FAK, and Src; β-actin was used as a loading control. (D and E) Confocal microscopy of integrin α5β1 staining of PBS-treated or rCCL18-treated MDA-MB-231 cells that were untransfected (D), or mock transfected, transfected with PITPNM3-siRNAs, FAK-siRNAs, integrin-β1-siRNAs, or GFP-siRNA (E). (F) Adherence assays for MDA-MB-231 cells that were untransfected, mock transfected, or transfected with GFP-siRNA or either of the FAK-siRNAs or integrin-β1-siRNAs in the presence or absence of rCCL18 at 20 ng/ml. (G) Boyden chamber assay for MDA-MB-231 cells that were untransfected (Un), mock transfected, or transfected with FAK-siRNAs, integrin-β1-siRNAs, or GFP-siRNA, followed by treatment for 8 hr with PBS or rCCL18. Bars correspond to mean ± SD. *p < 0.05 and ***p < 0.001 as compared with the untransfected cells. See also Figure S6.
Figure 7
Figure 7. CCL18 Promotes Lung and Liver Metastasis of Breast Cancer Xenografts via PITPNM3
(A) Microscopic images of H&E for breast cancer xenografts demonstrating the presence or absence of margin invasion (upper) and vascular invasion (lower) of BT-474 tumors. (B) Wet lung weight in tumor-bearing mice. Bars correspond to mean ± SD. (C) Luminal images of the lungs (left) and livers (right) of tumor-bearing mice. (D and F) H&E of the lungs (D) and livers (F) in the mice-bearing BT-474 (upper) and MDA-MB-231 (lower) xenografts. (E and G) Expression of human HPRT mRNA relative to mouse 18S rRNA in the lungs (E) and livers (G) of the tumor-bearing mice. Data are normalized to PBS-treated mice. (H) Kaplan-Meier survival curve for the mice-bearing BT-474 (left) and MDA-MB-231 xenografts (right). (I) Body weight of tumor-bearing mice. Bars correspond to mean ± SD. *p < 0.05, **p < 0.01, and ***p < 0.001 as compared with PBS-treated mice. See also Figure S7,and Tables S4 and S5.

Comment in

References

    1. Adema GJ, Hartgers F, Verstraten R, de Vries E, Marland G, Menon S, Foster J, Xu Y, Nooyen P, McClanahan T, et al. A dendritic-cell-derived C-C chemokine that preferentially attracts naive T cells. Nature. 1997;387:713–717. - PubMed
    1. Amarilio R, Ramachandran S, Sabanay H, Lev S. Differential regulation of endoplasmic reticulum structure through VAP-Nir protein interaction. J. Biol. Chem. 2005;280:5934–5944. - PubMed
    1. Chang CY, Lee YH, Leu SJ, Wang CY, Wei CP, Hung KS, Pai MH, Tsai MD, Wu CH. CC-chemokine ligand 18/pulmonary activation-regulated chemokine expression in the CNS with special reference to traumatic brain injuries and neoplastic disorders. Neuroscience. 2010;165:1233–1243. - PubMed
    1. Condeelis J, Pollard JW. Macrophages: obligate partners for tumor cell migration, invasion, and metastasis. Cell. 2006;124:263–266. - PubMed
    1. Coussens LM, Tinkle CL, Hanahan D, Werb Z. MMP-9 supplied by bone marrow-derived cells contributes to skin carcinogenesis. Cell. 2000;103:481–490. - PMC - PubMed

Publication types