. 2011 Apr 12;19(4):556-68.
doi: 10.1016/j.ccr.2011.03.003.

Conformational control inhibition of the BCR-ABL1 tyrosine kinase, including the gatekeeper T315I mutant, by the switch-control inhibitor DCC-2036

Affiliations

Conformational control inhibition of the BCR-ABL1 tyrosine kinase, including the gatekeeper T315I mutant, by the switch-control inhibitor DCC-2036

Wayne W Chan et al. Cancer Cell. .

Abstract

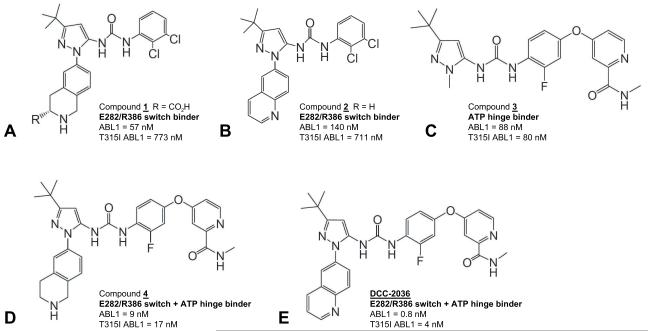
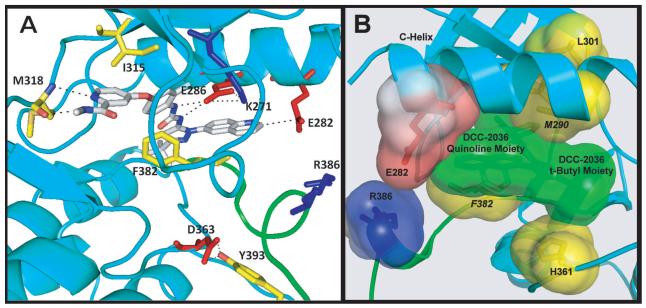
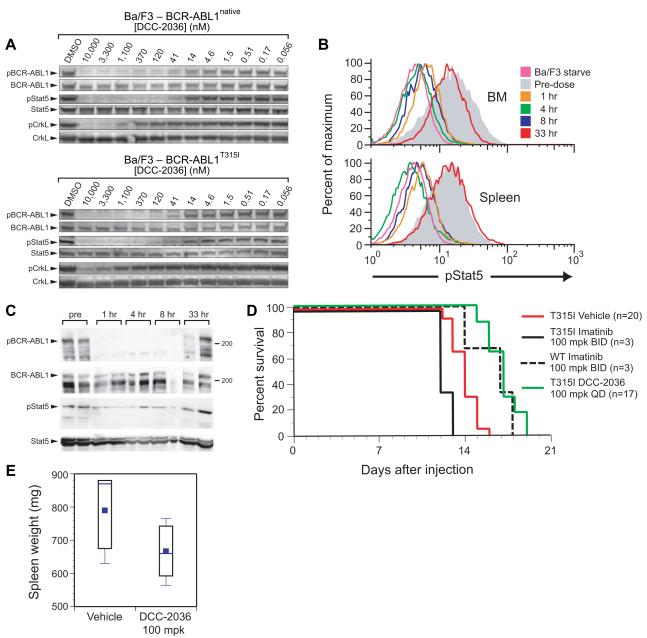
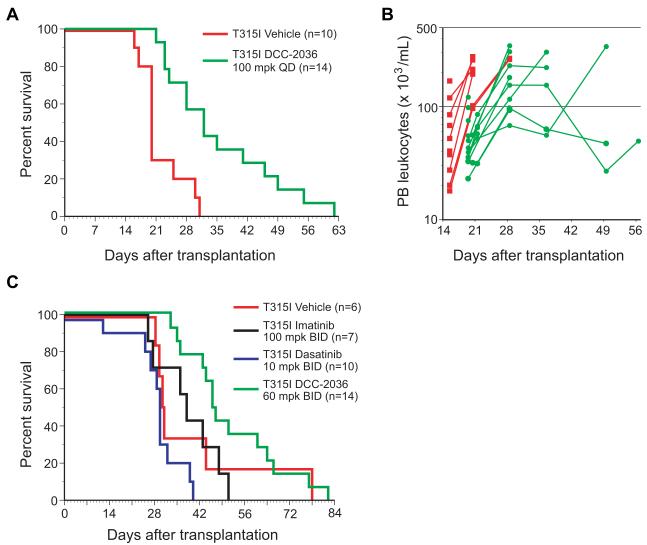
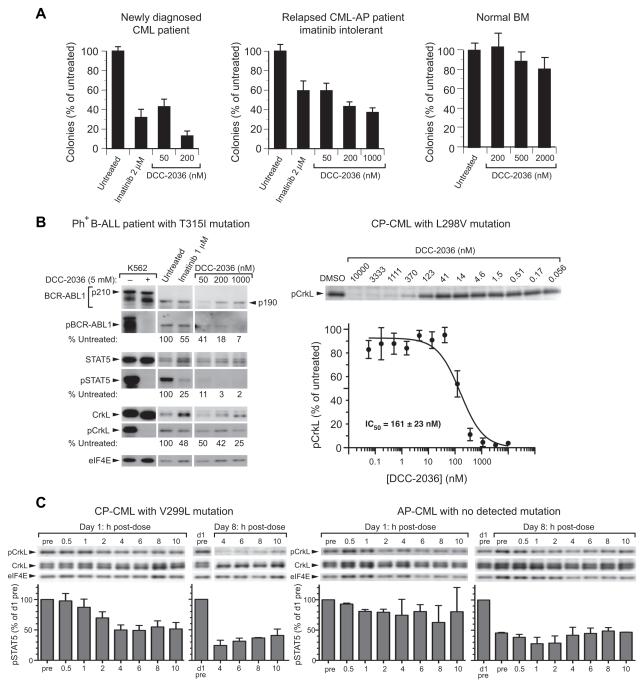
Acquired resistance to ABL1 tyrosine kinase inhibitors (TKIs) through ABL1 kinase domain mutations, particularly the gatekeeper mutant T315I, is a significant problem for patients with chronic myeloid leukemia (CML). Using structure-based drug design, we developed compounds that bind to residues (Arg386/Glu282) ABL1 uses to switch between inactive and active conformations. The lead "switch-control" inhibitor, DCC-2036, potently inhibits both unphosphorylated and phosphorylated ABL1 by inducing a type II inactive conformation, and retains efficacy against the majority of clinically relevant CML-resistance mutants, including T315I. DCC-2036 inhibits BCR-ABL1(T315I)-expressing cell lines, prolongs survival in mouse models of T315I mutant CML and B-lymphoblastic leukemia, and inhibits primary patient leukemia cells expressing T315I in vitro and in vivo, supporting its clinical development in TKI-resistant Ph(+) leukemia.


Figures

Figure 1
Figure 1. Structures of switch-control inhibitors of ABL1 kinase
(A) Compound 1 contains a tetrahydro-isoquinoline (THIQ) ring nitrogen that interacts with switch control amino acid E282; a pendant carboxylic acid moiety that interacts with switch control amino acid R386; a t-butyl moiety to bind into the hydrophobic spine position #3 pocket; and a 2,3-dichlorophenyl ring to bind into the extended hydrophobic pocket of ABL1. (B) Compound 2 replaces the THIQ ring with a quinoline ring. (C) Compound 3 contains a pyridine ring nitrogen and a pendant carboxamide-NH moiety to form hydrogen bonds with M318 at the ATP hinge. (D) Compound 4 incorporates the THIQ ring of compound 1 and the carboxamide containing pyridine ring of compound 3. (E) DCC-2036 incorporates the quinoline ring of compound 2 and the carboxamide containing pyridine ring of compound 3. The IC50 of each compound for inhibition of the kinase domains of purified ABL1native and ABL1T315I (see Experimental Procedures) are indicated. See also Figure S1 and Table S1.
Figure 2
Figure 2. Co-crystal structure of DCC-2036 bound to ABL1T315I kinase
(A) Ribbon diagram of the Type II conformation of ABL1T315I in complex with DCC-2036. Note the trajectory of the quinoline C2 carbon oriented towards E282 (d = 3.30 Å). The activation-loop internal switch (green) is in the ‘off state’, with F382 occluding the ATP pocket and Y393 occluding the substrate-binding pocket, making a hydrogen bond with D363. DCC-2036 makes additional hydrogen bonds with E286 (2.80 and 2.90 Å), and with the ATP hinge residue M318 (2.95 and 3.18 Å). Key hydrogen bonds and electrostatic interactions are highlighted as dashed lines. (B) View of the DCC-2036/ABL1T315I complex. The activating hydrophobic spine is disrupted by displacement of F382. DCC-2036 makes stabilizing interactions with spine residues M290, H361, and the displaced residue F382. DCC-2036 (t-Bu moiety) occupies the third position in this ‘inhibitory’ hydrophobic spine. Key interactions of the inhibitor quinoline ring with the E282/R386 switch pair are also shown. See also Figure S2 and Tables S1 and S2.
Figure 3
Figure 3. DCC-2036 inhibits BCR-ABL1 signaling in Ba/F3 cells in vitro and in a mouse allograft model
(A) Inhibition of BCR-ABL1 signaling in Ba/F3 cells expressing BCR-ABL1native (top panel) or BCR-ABL1T315I (bottom panel) by different concentrations of DCC-2036.. (B) Complete and sustained inhibition of pSTAT5 in mice bearing Ba/F3-BCR-ABL1T315I leukemia cells following a single oral dose of DCC-2036 at 100 mg/kg. At the indicated time after the dose, mice were sacrificed and the level of phosphorylation of STAT5 assessed in leukemic (GFP+) cells by intracellular staining with anti-pSTAT5 antibody and flow cytometric analysis. The grey histogram represents the level of STAT5 activation prior to the dose, while the pink curve is from parental Ba/F3 cells starved of IL-3 and serum, representing baseline STAT5 activation. (C) Immunoblot analysis of phospho-BCR-ABL1T315I and phospho-STAT5 levels in spleen tissue extracts from the experiment in (B). Note that due to contributions from non-leukemic cells, the extent of pSTAT5 inhibition is not as great as in panel (B). (D) Survival curve of cohorts of mice injected on day 0 with 106 Ba/F3 cells expressing either BCR-ABL1native or BCR-ABL1T315I, and treated beginning on day 3 with either imatinib at 100 mg/kg twice daily or DCC-2036 at 100 mg/kg once daily by oral gavage. The survival of the T315I DCC-2036-treated cohort was significantly longer than either the T315I imatinib-treated or vehicle-treated cohorts (P<0.0001, Wilcoxon test). (E) Box-style plot of spleen weights (mg) from Ba/F3-BCR-ABL1T315I leukemia-bearing mice treated with vehicle or DCC-2036, assessed at the time of morbidity or death. The difference in spleen weight of the DCC-2036-treated and the vehicle-treated cohorts was of borderline significance (p = 0.06, unpaired t-test).
Figure 4
Figure 4. DCC-2036 has efficacy in mouse models of CML and Ph+ B-ALL
(A) Survival curve for recipients of 5-FU-treated BM transduced with BCR-ABL1T315I retrovirus, treated by oral gavage beginning at day 5 post-transplant with vehicle (red line, n=10) or DCC-2036 at 100 mg/kg once daily (green line, n=14). All recipient mice succumbed to CML-like MPN. The difference in survival between the two cohorts is significant (p = 0.007, Wilcoxon test). (B) Scatter plot of peripheral blood leukocyte counts vs. time from the cohorts in panel (A). Red squares represent individual vehicle-treated mice, while green circles represent individual DCC-2036-treated mice. The difference in mean leukocyte counts on d20 between DCC-2036- and vehicle-treated cohorts was significant (p = 0.0002, unpaired t-test). (C) Survival curve for Balb/c recipients of non-5-FU-treated BM transduced with BCR-ABL1T315I retrovirus, treated by oral gavage beginning at day 10 post-transplant with vehicle (red line, n=6), imatinib at 100 mg/kg once daily (black line, n=7), dasatinib at 10 mg/kg twice daily (blue line, n=10), or DCC-2036 at 60 mg/kg twice daily (green line, n=14). The survival of the DCC-2036-treated cohort was significantly prolonged (Wilcoxon tests) compared to cohorts treated with vehicle (p = 0.0184), imatinib (p = 0.0474), and dasatinib (p < 0.0001).
Figure 5
Figure 5. DCC-2036 inhibits BCR-ABL1 in patient leukemic cells in vitro and in vivo
(A) Inhibition of BM-derived myeloid colonies (mean + SD) from a newly diagnosed CML chronic phase patient (left panel), a patient with relapsed CML in accelerated phase who was intolerant of imatinib (middle panel), and a normal individual (right panel). In the left and middle panels, the differences between any of the drug-treated cultures and Untreated were significant (p < 0.001, t-test), while none of the differences in the right panel were statistically significant. (B) Inhibition of BCR-ABL1 kinase activity and signaling by DCC-2036 in leukemic blasts from patients in vitro. Left panel: Patient with Ph+ B-ALL and the T315I mutation, which had an allele frequency of 40% estimated from DNA sequencing data. The relative levels of phospho-BCR-ABL1T315I, phospho-STAT5, and phospho-CrkL vs. untreated are shown. Note that this patient expressed the p190 isoform of BCR-ABL1T315I. Right panel: Patient with CP-CML and a L298V mutation. PB leukocytes were incubated for 3h with the indicated concentrations of DCC-2036, and CrkL phosphorylation quantitated by immunoblot analysis of quadruplicate blots. Data (mean normalized pCrkL ± SD) were fitted to a sigmoidal curve (GraphPad Prism) and an IC50 value calculated. (C) Pharmacodynamic analysis of inhibition of CrkL phosphorylation by DCC-2036 (tosylate salt in formulated tablets, 100 mg BID dose level) in circulating CML cells in vivo obtained on days 1 and 8 of cycle 1 of treatment in a Phase 1 clinical trial. Left panel: patient with CML chronic phase and V299L mutation (note that on day 8, samples before and 0.5-2 h after dosing were not obtained). Right panel: patient with CML accelerated phase and no detectable BCR-ABL1 mutation. pCrkL levels (mean + SD) normalized to percent of day 1 pre-dose level are shown below. See also Figure S3.

Comment in

References

    1. Azam M, Latek RR, Daley GQ. Mechanisms of autoinhibition and STI-571/imatinib resistance revealed by mutagenesis of BCR-ABL. Cell. 2003;112:831–843. - PubMed
    1. Azam M, Seeliger MA, Gray NS, Kuriyan J, Daley GQ. Activation of tyrosine kinases by mutation of the gatekeeper threonine. Nat. Struct. Mol. Biol. 2008;15:1109–1118. - PMC - PubMed
    1. Daley GQ, Van Etten RA, Baltimore D. Induction of chronic myelogenous leukemia in mice by the P210bcr/abl gene of the Philadelphia chromosome. Science. 1990;247:824–830. - PubMed
    1. Deininger MW, Druker BJ. Specific targeted therapy of chronic myelogenous leukemia with imatinib. Pharmacol. Rev. 2003;55:401–423. - PubMed
    1. Donato NJ, Fang D, Sun H, Giannola D, Peterson LF, Talpaz M. Targets and effectors of the cellular response to aurora kinase inhibitor MK-0457 (VX-680) in imatinib sensitive and resistant chronic myelogenous leukemia. Biochem. Pharmacol. 2010;79:688–697. - PubMed

Publication types

MeSH terms

Substances