Frequency-selective heteronuclear dephasing and selective carbonyl labeling to deconvolute crowded spectra of membrane proteins by magic angle spinning NMR
- PMID: 21482162
- PMCID: PMC3328402
- DOI: 10.1016/j.jmr.2011.03.013
Frequency-selective heteronuclear dephasing and selective carbonyl labeling to deconvolute crowded spectra of membrane proteins by magic angle spinning NMR
Abstract
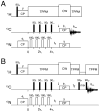
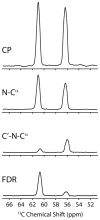
We present a new method that combines carbonyl-selective labeling with frequency-selective heteronuclear recoupling to resolve the spectral overlap of magic angle spinning (MAS) NMR spectra of membrane proteins in fluid lipid membranes with broad lines and high redundancy in the primary sequence. We implemented this approach in both heteronuclear (15)N-(13)C(α) and homonuclear (13)C-(13)C dipolar assisted rotational resonance (DARR) correlation experiments. We demonstrate its efficacy for the membrane protein phospholamban reconstituted in fluid PC/PE/PA lipid bilayers. The main advantage of this method is to discriminate overlapped (13)C(α) resonances by strategically labeling the preceding residue. This method is highly complementary to (13)C(i-1)(')-(15)N(i)-(13)C(i)(α) and (13)C(i-1)(α)-(15)N(i-1)-(13)C(i)(') experiments to distinguish inter-residue spin systems at a minimal cost to signal-to-noise.
Copyright © 2011 Elsevier Inc. All rights reserved.
Figures


Similar articles
-
Sensitivity and resolution enhancement of oriented solid-state NMR: application to membrane proteins.Prog Nucl Magn Reson Spectrosc. 2013 Nov;75:50-68. doi: 10.1016/j.pnmrs.2013.07.004. Epub 2013 Aug 12. Prog Nucl Magn Reson Spectrosc. 2013. PMID: 24160761 Free PMC article. Review.
-
Dipolar Assisted Assignment Protocol (DAAP) for MAS solid-state NMR of rotationally aligned membrane proteins in phospholipid bilayers.J Magn Reson. 2014 May;242:224-32. doi: 10.1016/j.jmr.2014.02.018. Epub 2014 Mar 1. J Magn Reson. 2014. PMID: 24698983 Free PMC article.
-
Reducing the effects of weak homonuclear dipolar coupling with CPMG pulse sequences for static and spinning solids.J Magn Reson. 2022 Apr;337:107174. doi: 10.1016/j.jmr.2022.107174. Epub 2022 Feb 24. J Magn Reson. 2022. PMID: 35279507
-
REDOR NMR on a hydrophobic peptide in oriented membranes.J Magn Reson. 2000 Dec;147(2):366-70. doi: 10.1006/jmre.2000.2187. J Magn Reson. 2000. PMID: 11097827
-
Recent progress in dipolar recoupling techniques under fast MAS in solid-state NMR spectroscopy.Solid State Nucl Magn Reson. 2021 Apr;112:101711. doi: 10.1016/j.ssnmr.2020.101711. Epub 2021 Jan 11. Solid State Nucl Magn Reson. 2021. PMID: 33508579 Review.
Cited by
-
Identifying inter-residue resonances in crowded 2D (13)C- (13)C chemical shift correlation spectra of membrane proteins by solid-state MAS NMR difference spectroscopy.J Biomol NMR. 2013 Jul;56(3):265-73. doi: 10.1007/s10858-013-9745-7. Epub 2013 May 25. J Biomol NMR. 2013. PMID: 23708936 Free PMC article.
-
Isotope labeling for solution and solid-state NMR spectroscopy of membrane proteins.Adv Exp Med Biol. 2012;992:35-62. doi: 10.1007/978-94-007-4954-2_3. Adv Exp Med Biol. 2012. PMID: 23076578 Free PMC article. Review.
-
Combination of ¹⁵N reverse labeling and afterglow spectroscopy for assigning membrane protein spectra by magic-angle-spinning solid-state NMR: application to the multidrug resistance protein EmrE.J Biomol NMR. 2013 Apr;55(4):391-9. doi: 10.1007/s10858-013-9724-z. Epub 2013 Mar 29. J Biomol NMR. 2013. PMID: 23539118 Free PMC article.
-
Utilizing afterglow magnetization from cross-polarization magic-angle-spinning solid-state NMR spectroscopy to obtain simultaneous heteronuclear multidimensional spectra.J Phys Chem B. 2012 Jun 21;116(24):7138-44. doi: 10.1021/jp303269m. Epub 2012 May 31. J Phys Chem B. 2012. PMID: 22582831 Free PMC article.
-
De novo resonance assignment of the transmembrane domain of LR11/SorLA in E. coli membranes.J Magn Reson. 2020 Jan;310:106639. doi: 10.1016/j.jmr.2019.106639. Epub 2019 Nov 1. J Magn Reson. 2020. PMID: 31734618 Free PMC article.
References
-
- Baldus M. Correlation experiments for assignment and structure elucidation of immobilized polypeptides under magic angle spinning. Prog Nucl Magn Reson Spectrosc. 2002;41:1–47.
-
- Watts A, Ulrich AS, Middleton DA. Membrane protein structure: the contribution and potential of novel solid state NMR approaches. Mol Membr Biol. 1995;12:233–246. - PubMed
Publication types
MeSH terms
Substances
Grants and funding
LinkOut - more resources
Full Text Sources

