. 2011 May 9;208(5):937-48.
doi: 10.1084/jem.20102167. Epub 2011 Apr 11.

Overexpression of cdk4 and cyclinD1 triggers greater expansion of neural stem cells in the adult mouse brain

Affiliations

Overexpression of cdk4 and cyclinD1 triggers greater expansion of neural stem cells in the adult mouse brain

Benedetta Artegiani et al. J Exp Med. .

Abstract

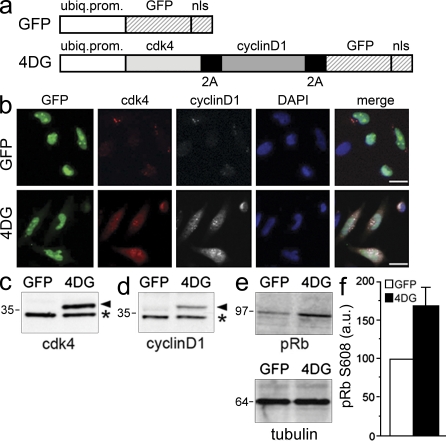
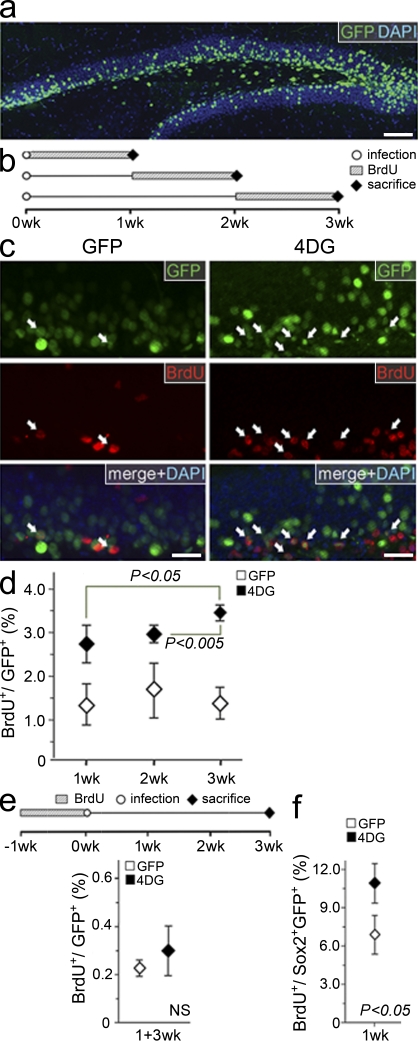
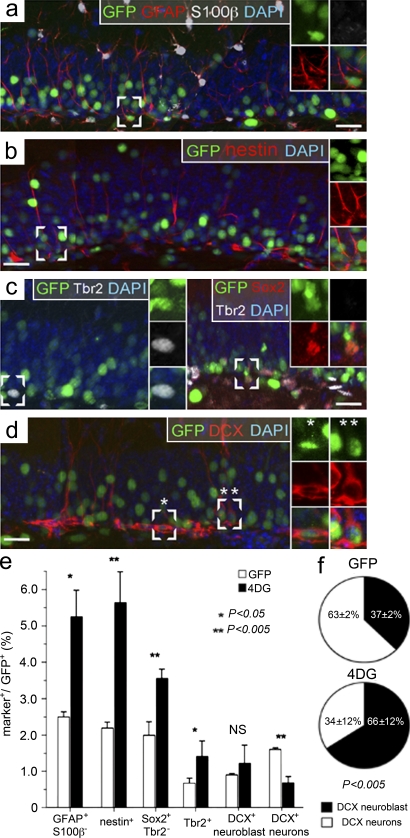
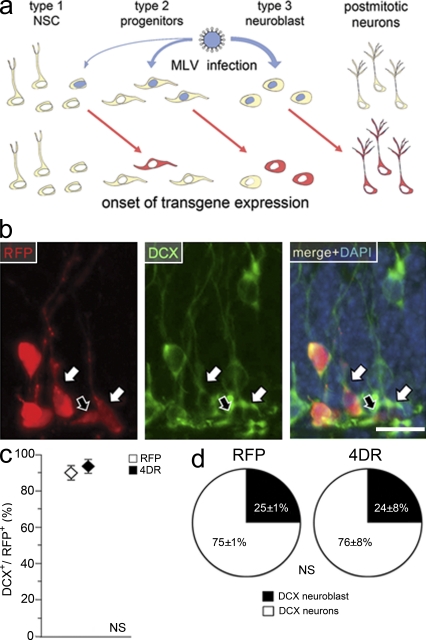
Neural stem cells (NSCs) in the adult mammalian brain generate neurons and glia throughout life. However, the physiological role of adult neurogenesis and the use of NSCs for therapy are highly controversial. One factor hampering the study and manipulation of neurogenesis is that NSCs, like most adult somatic stem cells, are difficult to expand and their switch to differentiation is hard to control. In this study, we show that acute overexpression of the cdk4 (cyclin-dependent kinase 4)-cyclinD1 complex in the adult mouse hippocampus cell-autonomously increases the expansion of neural stem and progenitor cells while inhibiting neurogenesis. Importantly, we developed a system that allows the temporal control of cdk4-cyclinD1 overexpression, which can be used to increase the number of neurons generated from the pool of manipulated precursor cells. Beside providing a proof of principle that expansion versus differentiation of somatic stem cells can be controlled in vivo, our study describes, to the best of our knowledge, the first acute and inducible temporal control of neurogenesis in the mammalian brain, which may be critical for identifying the role of adult neurogenesis, using NSCs for therapy, and, perhaps, extending our findings to other adult somatic stem cells.


Figures

Figure 1.
Figure 1.
Coexpression of catalytically active 4D complex and GFP by lentiviruses. (a) Control GFP (top) and 4DG (bottom) viral transfer vectors used in this study. Note the use of the ubiquitin promoter (ubiq. prom.), the presence of the nuclear localization signal (nls) in both vectors, and the use of 2A sequences to link the three transgenes in 4DG. (b) Fluorescence pictures of HeLa cells after GFP (top) or 4DG (bottom) infection and immunocytochemistry for cdk4 (red), cyclinD1 (white), and DAPI counterstaining (blue) representative of two independent experiments. Bars, 20 µm. (c and d) Western blot analyses of GFP- or 4DG-infected HeLa cells using cdk4 (c) or cyclinD1 (d) antibodies. Note the higher molecular mass (kilodaltons) of ectopic (arrowheads), relative to endogenous (asterisks), cdk4 and cyclinD1 proteins in samples infected with 4DG viruses caused by fusion of the cell cycle regulators with a 2A peptide. (e and f) Western blot analyses (e) and quantification (f) of retinoblastoma (pRb) using antibodies specific for phosphorylated Ser608 (e, top) upon tubulin normalization as loading control (e, bottom); values in controls are defined as GFP = 100 arbitrary units (a.u.); n = 2; error bar represents SEM.
Figure 2.
Figure 2.
4DG increases the proliferation in the adult hippocampus. (a) Composite picture of a 40-µm thick vibratome section through the mouse hippocampus showing GFP fluorescence and DAPI counterstaining 3 wk after infection with GFP viruses. (b) Layout of the experiments performed to investigate effects on proliferation. BrdU administration and sacrifice are indicated at 1, 2, or 3 wk after infection (0 wk). (c) Fluorescence pictures of the granular and subgranular zone 3 wk after infection with GFP (left) or 4DG (right) viruses and 7 d of BrdU administration as depicted in b, followed by immunohistochemistry for GFP (top), BrdU (middle), and DAPI counterstaining (shown as merge; bottom). Arrows indicate BrdU+ GFP+ cells. (d) Quantification of the proportion (percentage) of BrdU+ cells as in c after GFP or 4DG infection (P < 0.05 between any GFP and 4DG time point; significance among 4DG time points are indicated). (e) Layout of the experiments (top) and quantifications (bottom) to determine the proportion of label (BrdU)-retaining cells after GFP or 4DG infection. (f) Proportion (percentage) of BrdU+ cells within the population of Sox2+ GFP+ 1 wk after GFP or 4DG infection and 1 wk of BrdU exposure as shown in b (top). (d–f) Data are the mean of three (six in d, 1 wk; four in f, GFP) hippocampi of different animals; error bars represent SD; differences between GFP time points in d and between GFP and 4DG in e are not significant. Bars: (a) 100 µm; (c) 20 µm.
Figure 3.
Figure 3.
4DG increases the expansion of stem and progenitor cells at the expense of neurogenesis. (a–d) Fluorescence pictures of the granular and subgranular zone 3 wk after infection with GFP viruses and immunohistochemistry for GFP in combination with various cellular markers and DAPI counterstaining. White frames outline GFP+ cells scored as GFAP+ S100-β (a), nestin+ (b), Tbr2+ (c, left), Sox2+ Tbr2 (c, right), DCX+ neuroblast (d, one asterisk, left), and DCX+ neuron (d, two asterisks, right) cells, whose individual channels are shown magnified in the right insets. Bars, 20 µm. (e) Proportions (percentages) of the different GFP+ cell types as shown in a–d 3 wk after GFP or 4DG infection (all GFP+ cells = 100%). (f) Pie graphs showing the proportion (percentage) of DCX+ type 3 neuroblasts and DCX+ neurons 3 wk after GFP (top) or 4DG (bottom) infection (all DCX+ cells = 100%). (e and f) Data are the mean of at least three hippocampi of different animals; error bars represent SD; p-values are indicated.
Figure 4.
Figure 4.
4D overexpression does not affect survival of newborn neurons. (a) Schematic representation of the effect induced by MLV infection with efficiency of infection (top; blue arrows) being proportional to the proliferation rate of stem or progenitor cells (from left to right, respectively). Onset of transgene expression (bottom) would preferentially occur in the daughters (red arrows and cells) of infected mother cells (top; blue nuclei) with the majority of red cells being DCX+ type 3 neuroblast or newborn neurons. (b) Fluorescence pictures of the granular and subgranular zone 3 wk after RFP infection and immunohistochemistry for RFP (left), DCX (middle), and DAPI counterstaining (shown as merge; right). Arrows indicate cells scored as DCX+ neuroblasts (black) or DCX+ neurons (white). Bar, 20 µm. (c) Proportion (percentage) of DCX+ cells within the population of RFP+ cells 3 wk after RFP or 4DR infection. (d) Pie graphs showing the proportion (percentage) of DCX+ neuroblasts and DCX+ neurons 3 wk after RFP (left) or 4DR (right) infection (all DCX+ cells = 100%). (c and d) Data are the mean of three hippocampi of different animals; error bars represent SD; differences are not significant.
Figure 5.
Figure 5.
A transient 4D overexpression increases the generation of neurons. (a) GFPlox (top) and Glox4D (bottom) transfer vectors used for the temporal control of 4D overexpression. Note the presence of loxP sites to remove the nuclear localization signal (nls) alone (GFPlox) or together with the 4D cassette (Glox4D). (b) Layout of the experiments with a 2-d administration of tamoxifen and sacrifice occurring at 3 wk and 5 wk after viral infection, respectively, in nestin-CreERt2 mice. (c) Fluorescence pictures of the granular and subgranular zone 3 wk after infection with GFPlox (left) or Glox4D (right) viruses and immunohistochemistry for GFP (top), DCX (middle), and DAPI counterstaining (shown as merge; bottom). DCX+ GFPcyt+ cells are indicated by arrows. Bars, 20 µm. (d–f) Proportion (percentage) of GFPcyt+ cells within the GFP+ population (d), DCX+ neurons within the DCX+ GFPcyt+ population (e), and DCX+ neurons within all GFP+ cells (f) after GFPlox or Glox4D infection as depicted in b. Data are the mean of at least three hippocampi of different animals; error bars represent SD; p-values are indicated; difference in e is not significant. No significant difference was found between quantifications shown in panel e, Fig. 4 d, and controls in Fig. 3 f (top; analysis of variance F > 0.55).
Figure 6.
Figure 6.
The effects of 4D are cell intrinsic. (a and b) Fluorescence pictures of the granular and subgranular zone 3 wk after infection with GFP viruses and immunohistochemistry for GFP, S100-β or Olig2 (a and b, respectively), and DAPI counterstaining. White frames indicate GFP+ cells that have been scored as S100-β+ (a) or Olig2+ (b), whose individual channels are shown magnified in the right insets. Bars, 20 µm. (c) Proportions (percentages) of S100-β+ and Olig2+ cells among the GFP+ population 3 wk after GFP or 4DG infection (all GFP+ cells = 100%). (d) Absolute number of BrdU+ GFP cells per cubic millimeter of granular plus subgranular zone 3 wk after GFP or 4DG infection. (e) Layout of the experiments and quantifications (gray bar) of BrdU+ GFP+ cells 3 wk after Glox4D infection in nestin-CreERt2 mice with a 2-d tamoxifen administration starting 24 h after viral infection and BrdU administration performed during the 7 d preceding sacrifice. Data of wild-type mice infected with GFP or 4DG viruses (white and black bars, respectively) were taken from Fig. 2 d (3-wk time point) and added for better comparison. (c–e) Data are the mean of at least three hippocampi of different animals; error bars represent SD; **, P < 0.001; difference in c, d, and e (bottom, white and gray bars) is not significant.
Figure 7.
Figure 7.
Proposed effect of 4D manipulation. (a–d) Markers used to assess the cell types of the adult hippocampus (a) with proportion of cells (b–d) approximately representing the values quantified in our study. Colored arrows underneath cells indicate the lineage from NSCs (yellow) to neurons (blue), with thickness representing the absolute number of cells progressing from one to the next cell population. (c) Note the increase in type 1 NSCs and type 2 progenitors upon 3-wk overexpression of the 4D complex with concomitant reduction in neurogenesis relative to control (b) as represented by a thickening of the left end of the arrow and thinning toward the right. (d) 3 wk of 4D overexpression followed by removal of the 4D cassette for an additional 2 wk induced a twofold increase in newborn neurons. In this case, proportions of other cell types were represented assuming a physiological balance between proliferation and differentiation as depicted by an arrow of the same proportion, but thicker, than in b.

References

    1. Arai Y., Pulvers J.N., Haffner C., Schilling B., Nüsslein I., Calegari F., Huttner W.B. 2011. Neural stem and progenitor cells shorten S-phase on commitment to neuron production. Nat Commun. 2:154 10.1038/ncomms1155 - DOI - PMC - PubMed
    1. Calegari F., Haubensak W., Haffner C., Huttner W.B. 2005. Selective lengthening of the cell cycle in the neurogenic subpopulation of neural progenitor cells during mouse brain development. J. Neurosci. 25:6533–6538 10.1523/JNEUROSCI.0778-05.2005 - DOI - PMC - PubMed
    1. Cameron H.A., McKay R.D. 2001. Adult neurogenesis produces a large pool of new granule cells in the dentate gyrus. J. Comp. Neurol. 435:406–417 10.1002/cne.1040 - DOI - PubMed
    1. de Felipe P., Luke G.A., Hughes L.E., Gani D., Halpin C., Ryan M.D. 2006. E unum pluribus: multiple proteins from a self-processing polyprotein. Trends Biotechnol. 24:68–75 10.1016/j.tibtech.2005.12.006 - DOI - PubMed
    1. Deng W., Aimone J.B., Gage F.H. 2010. New neurons and new memories: how does adult hippocampal neurogenesis affect learning and memory? Nat. Rev. Neurosci. 11:339–350 10.1038/nrn2822 - DOI - PMC - PubMed

Publication types