. 2011 Apr 18;193(2):319-32.
doi: 10.1083/jcb.201009100. Epub 2011 Apr 11.

Tara up-regulates E-cadherin transcription by binding to the Trio RhoGEF and inhibiting Rac signaling

Affiliations

Tara up-regulates E-cadherin transcription by binding to the Trio RhoGEF and inhibiting Rac signaling

Tomoki Yano et al. J Cell Biol. .

Abstract

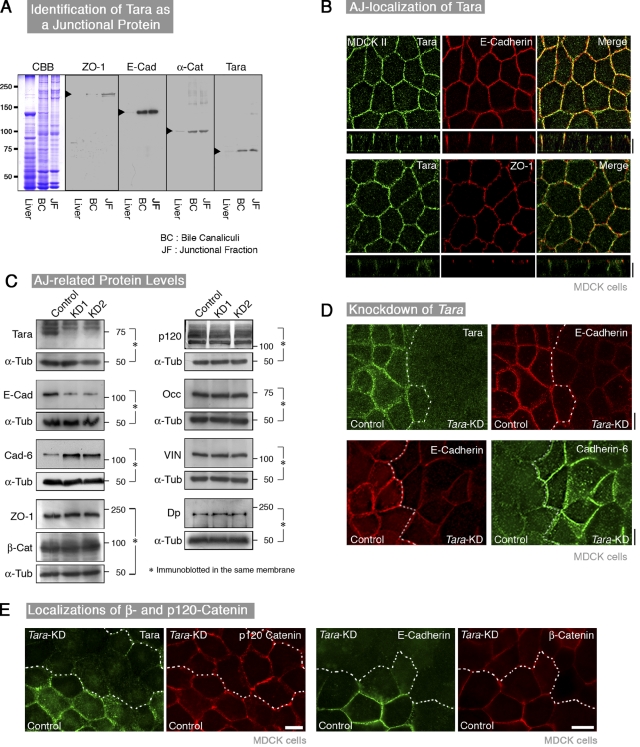
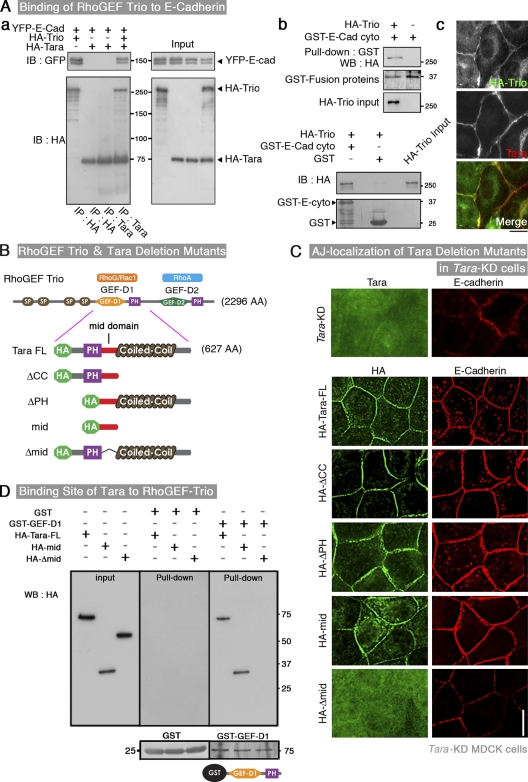
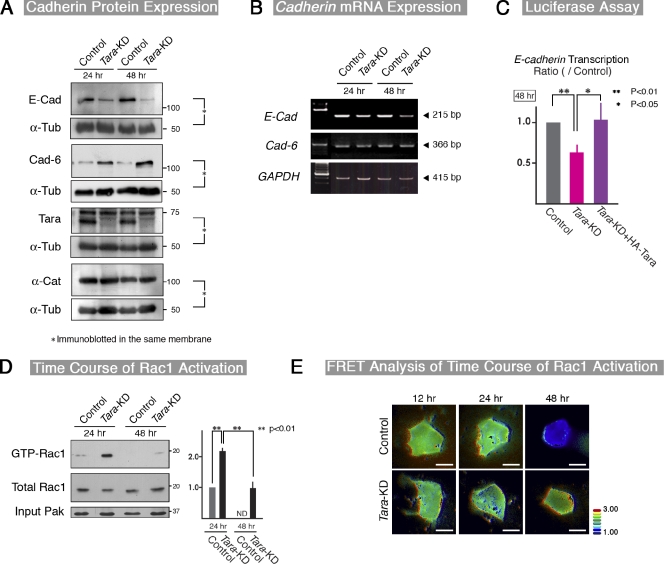
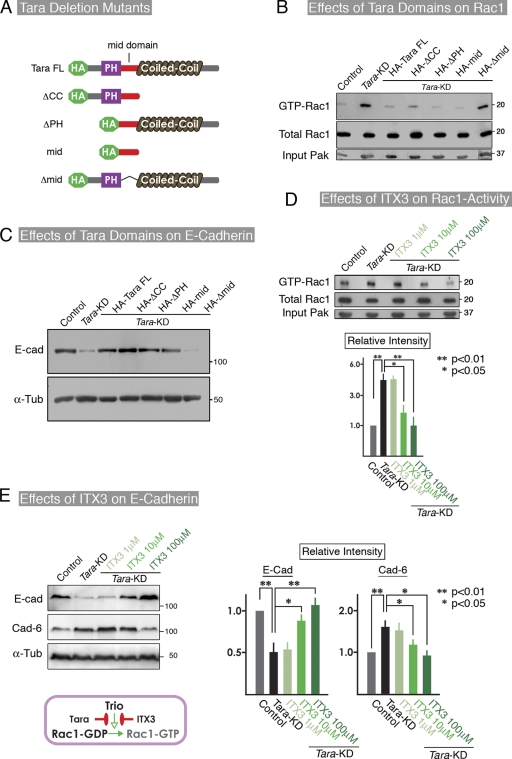
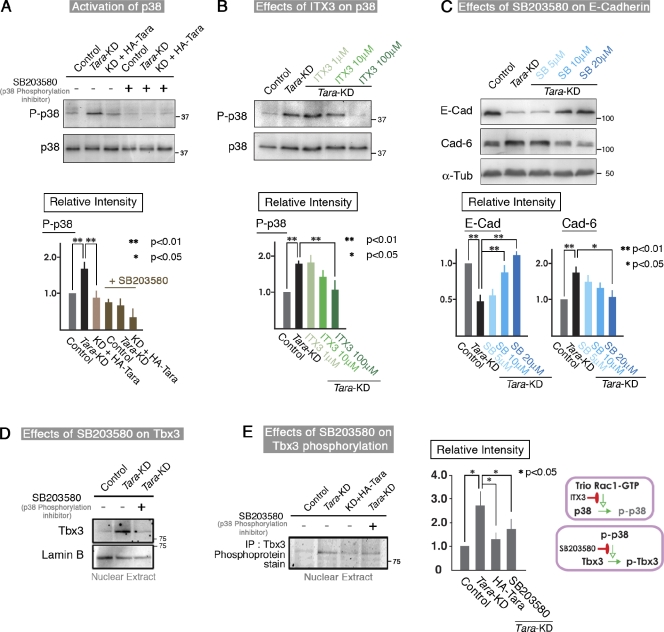
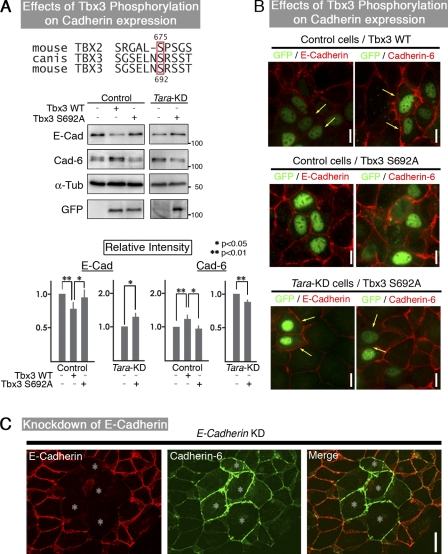
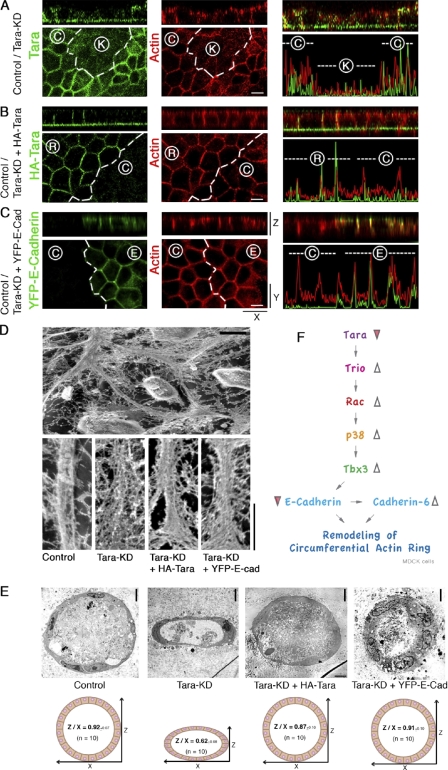
The spatiotemporal regulation of E-cadherin expression is important during body plan development and carcinogenesis. We found that Tara (Trio-associated repeat on actin) is enriched in cadherin-based adherens junctions (AJs), and its knockdown in MDCK cells (Tara-KD cells) significantly decreases the expression of E-cadherin. Tara-KD activates Rac1 through the Trio RhoGEF, which binds to E-cadherin and subsequently increases the phosphorylation of p38 and Tbx3, a transcriptional E-cadherin repressor. Accordingly, the decrease in E-cadherin expression is abrogated by ITX3 and SB203580 (specific inhibitors of Trio RhoGEF and p38MAPK, respectively), and by dephosphomimetic Tbx3. Despite the decreased E-cadherin expression, the Tara-KD cells do not undergo an epithelial-mesenchymal transition and remain as an epithelial cell sheet, presumably due to the concomitant up-regulation of cadherin-6. Tara-KD reduces the actin-belt density in the circumferential ring, and the cells form flattened cysts, suggesting that Tara functions to modulate epithelial cell sheet formation and integrity by up-regulating E-cadherin transcription.


Figures

Figure 1.
Figure 1.
Identification of Tara as an AJ component, whose knockdown down-regulates the expression of E-cadherin. (A) Immunoblotting of the liver, bile canaliculi (BC), and the cell–cell junctional fraction (JF) with an anti-Tara antibody. Tara was enriched in the BC and JF. (B) Immunofluorescence micrographs of MDCK cells. Cells were costained for Tara with E-cadherin or ZO-1 to mark adherens or tight junctions, respectively. Top panels: Tara, green; E-cadherin, red. Bottom panels: Tara, green; ZO-1, red. Bar, 10 µm. Tara was colocalized with E-cadherin at cell–cell adherens junctions, at a position basolateral to the tight junctions. (C) Immunoblotting of Tara-KD and control MDCK cells (two clones) for cell–cell adhering junctional proteins. Control: mock-transfected MDCK cells. KD1 and KD2: Tara-KD MDCK cells (two clones). E-cad, E-cadherin; Cad-6, cadherin-6; β-Cat, β-catenin; p120, p120-catenin; Vin, vinculin; Occ, occludin; Dp, desmoplakin. Loading controls were prepared by probing portions of the same filter by anti–α-tubulin and the antibody for the respective experimental protein, except for Cad-6 and β-Cat, which were probed in the presence of the loading control anti–α-tub at the same time by mixture of antibodies. (D) Immunofluorescence micrographs of co-cultured Tara-KD and control mock-transfected MDCK cells stained for E-cadherin and cadherin-6. The E-cadherin signals were decreased in the Tara-KD cells. Note that the cadherin-6 signals were increased by Tara-KD. Tara, green; E-cadherin, red; cadherin-6, green (cy5-staining). Bar, 10 µm. (E) Immunofluorescence micrographs of co-cultured Tara-KD and control mock-transfected MDCK cells stained for p120- and β-catenins. Note that the immunofluorescence levels of the p120- and β-catenins at AJs were not changed by Tara-KD.
Figure 2.
Figure 2.
Association of Tara with Trio RhoGEF, which binds E-cadherin. (A, a) Coimmunoprecipitations among YFP-E-cadherin, HA-Trio, and HA-Tara. After the transient expression (see input) in HEK293 cells of tagged forms of Tara, E-cadherin, and Trio, a reported binding partner of Tara, YFP–E-cadherin was detected in the immunoprecipitates of HA-Tara in the presence, but not the absence, of HA-Trio. (b) Linkage between Trio and E-cadherin. HA-Trio was pulled down by a GST fusion protein of the cytoplasmic domain of E-cadherin. (c) Immunofluorescence of transiently expressed HA-Trio. The cell–cell AJs lit up, as indicated by the Tara costaining pattern. Bar, 5 µm. (B) Schematic drawing of Trio RhoGEF and the Tara deletion constructs. (C) Immunofluorescence micrographs of Tara-KD MDCK cells stably transfected with HA-tagged Tara deletion mutants. All the constructs except for the one lacking the mid-domain were localized to the AJ and up-regulated the immunofluorescent signals for E-cadherin. HA, green; E-cadherin, red. Bar, 10 µm. (D) Pull-down assay of full-length and mid-domain Tara, and full-length Tara lacking the mid-domain, with GST fusion proteins of the Trio RhoGEF RhoG/Rac1-GEF domain (GEF-D1) or GST (a control). The mid-domain of Tara was essential for Tara’s interaction with the GEF-D1 domain.
Figure 3.
Figure 3.
Tara-KD–dependent regulation of E-cadherin expression and Rac1 activation. (A) Immunoblotting of control MDCK and Tara-KD cells for E-cadherin, cadherin-6, and α-catenin at 24 and 48 h after EDTA/trypsin treatment and replating. Note the marked decrease in the protein level of E-cadherin by Tara-KD. The protein level of cadherin-6 was increased by Tara-KD compared with control cells. Each of E-cadherin, cadherin-6, Tara, and α-catenin was probed by its antibody in the presence of the loading control anti–α-tub at the same time by mixing antibodies. (B and C) Semi-quantitative RT-PCR (B) and luciferase reporter assays (C) for the effect of Tara-KD on E-cadherin mRNA levels and promoter activity, respectively. Note that the E-cadherin mRNA and its promoter activity, respectively, decreased significantly at 48 h after cells were seeded (B and C), whereas there was no obvious change in the cadherin-6 mRNA level (not depicted). The results are expressed as means ± SD (error bars) and are representative of four independent experiments. **, P < 0.01; *, P < 0.05. (D) Effect of Tara-KD on the level of active Rac-1 determined by a PAK pull-down assay. The Rac1 activity was increased in Tara-KD cells 24 h after replating. The quantification of the immunoblotted signals revealed the significant changes of Rac1 activation by Tara-KD at 24 and 48 h after being seeded (see the right panel). ND, not detected. Densitometric quantification of Western blot bands was performed using Photoshop 7.0 (Adobe). As to the “Relative Intensity,” the ratio of intensity of GTP-Rac1 to total-Rac in control was normalized to 1.0. The results are expressed as means ± SD (error bars) and are representative of three independent experiments. **, P < 0.01; *, P < 0.05. (E) FRET analysis of Rac activation. At 12 and 24 h after replating, the Rac1 activation was detected at cell–cell contacts in both control and Tara-KD cells. At 48 h, Rac activation was still detectable in Tara-KD cells but not in control cells. Bar, 10 µm.
Figure 4.
Figure 4.
Involvement of Trio in Tara-KD–dependent regulation of E-cadherin expression and Rac1 activation. (A) Schematic drawing of the Tara deletion constructs. (B) The Tara domain responsible for regulating the activation of Rac1. The mid-domain of Tara was sufficient to cause the down-regulation of Rac1 activation in Tara-KD cells. (C) Analysis of the Tara domain responsible for the restoration of E-cadherin in Tara-KD cells, by transfection with Tara deletion mutants. Consistent with the Rac1 activity, the mid-domain of Tara was essential to rescue the expression of E-cadherin in Tara-KD cells. (D) Effect of the Trio RhoGEF inhibitor ITX3 on the activation level of Rac1 in Tara-KD cells. In the presence of 100 µM ITX3, the Rac1 activation in Tara-KD cells was markedly decreased, to the level in control cells. The results are expressed as means ± SD (error bars) and are representative of three independent experiments. **, P < 0.01; *, P < 0.05. Densitometric quantification of Western blot bands was performed using Photoshop 7.0 (Adobe). As to the “Relative Intensity,” the ratio of intensities of E-cadherin to α-tubulin and cadherin-6 to α-tubulin in control were normalized to 1.0. (E) Effect of ITX3 on the expression of E-cadherin and cadherin-6 in Tara-KD cells. ITX3 blocked the Tara-KD–induced down-regulation of E-cadherin and up-regulation of cadherin-6 in a dose-dependent manner. The right panels show the quantification of the immunoblotting data (as shown in Fig. S4 C). The results are expressed as means ± SD (error bars) and are representative of three independent experiments, in which antigens were immunoblotted in the same membranes. **, P < 0.01; *, P < 0.05.
Figure 5.
Figure 5.
Tara-KD regulates the p38MAPK/Tbx3 pathway downstream of Rac1. (A and B) Immunoblotting for phospho-p38MAPK in Tara-KD cells in the presence or absence of SB203580 (A) or ITX3 (B). The phosphorylation level of p38MAPK was markedly up-regulated in Tara-KD cells compared with control cells. SB203580, a p38MAPK phosphorylation inhibitor, dose dependently decreased the phosphorylation level of p38, as did ITX3, an inhibitor of the Rac1-GEF activity of Trio RhoGEF. The bottom panels show the quantification of the immunoblotting data (as shown in Fig. S4 C). The results are expressed as means ± SD (error bars) and are representative of three independent experiments. **, P < 0.01; *, P < 0.05. Densitometric quantification of Western blot bands was performed using Photoshop 7.0 (Adobe). As to the “Relative Intensity,” the ratio of intensities of P-p38 to p38 in control was normalized to 1.0. (C) Immunoblotting for E-cadherin and cadherin-6 in Tara-KD cells. The Tara-KD–induced decrease of E-cadherin and increase of cahderin-6 were dose dependently inhibited by the presence of SB203580. The bottom panels show the quantification of the immunoblotting data (Fig. S4 C). The basically same results were obtained with another inhibitor of p38, SB202190. The results are expressed as means ± SD (error bars) and are representative of three independent experiments, in which antigens were immunoblotted in the same membranes. **, P < 0.01; *, P < 0.05. Densitometric quantification of Western blot bands was performed using Photoshop 7.0 (Adobe). As to the “Relative Intensity,” the ratio of intensities of E-cadherin to α-tubulin and cadherin-6 to α-tubulin in control were normalized to 1.0. (D) Immunoblotting of nuclear extracts of Tara-KD and control cells for Tbx3. The amount of nuclear Tbx3 in the Tara-KD cells was higher than that in the control cells. SB203850 blocked the increase in nuclear Tbx3 in the Tara-KD cells to the control level. (E) The phosphorylation level of nuclear Tbx3 was approximately fourfold increased in the Tara-KD cells compared with control cells, and the transfection of HA-Tara or the addition of SB203580 suppressed the increased Tbx3 phosphorylation level by ∼50%. The results are expressed as means ± SD (error bars) and are representative of three independent experiments. **, P < 0.01; *, P < 0.05.
Figure 6.
Figure 6.
Tbx3-dependent E-cadherin expression whose decrease leads to increased cadherin-6. (A and B) Tbx3-dependent E-cadherin expression in MDCK cells and Tara-KD cells. Mouse S692 of Tbx3 (outlined in red) was the predicted phosphorylation site, based on its conservation with S675 of mouse Tbx2. As shown in immunoblotting of stable clones (A) and immunofluorescence micrographs of transient transfectants (with green nuclei, B), when exogenous wild-type Tbx3 was expressed in MDCK cells, the E-cadherin expression was decreased, and the cadherin-6 expression increased concomitantly. The dephosphomimic Tbx3 (Tbx3-S692A) showed no inhibition of E-cadherin expression (A). When exogenous wild-type Tbx3 was expressed in MDCK cells, the E-cadherin expression was decreased, and the cadherin-6 expression increased concomitantly. The dephosphomimic Tbx3 (Tbx3-S692A) showed no inhibition of E-cadherin expression. The dephosphomimetic Tbx3 suppressed the down-regulation of E-cadherin and the up-regulation of cadherin-6 in Tara-KD cells. Densitometric quantification of Western blot bands was performed using Photoshop 7.0 (Adobe). As to the “Relative Intensity,” the ratio of intensities of E-cadherin to α-tubulin and cadherin-6 to α-tubulin in control were normalized to 1.0. The results are expressed as means ± SD (error bars) and are representative of three independent experiments, in which antigens were immunoblotted in the same membranes. **, P < 0.01; *, P < 0.05. The transfected cells are the ones with green nuclei. Bar, 10 µm. (C) Knockdown of E-cadherin in MDCK cells. E-cadherin, red; cadherin-6, green (cy5-staining). Bar, 10 µm. When the immunofluorescent signals of E-cadherin were decreased by E-cadherin-KD in MDCK cells, those for cadherin-6 increased.
Figure 7.
Figure 7.
Tara-dependent maturation of the circumferential ring. (A–C) Confocal immunofluorescence micrographs of Tara-KD cells with or without transfection of HA-Tara or YFP–E-cadherin cultured with untransfected control MDCK cells. In co-cultures of control and Tara-KD cells, the Tara-KD cells showed a lower actin signal intensity at the zAJ/CR and cell–cell contacts than the control cells (A). In contrast, Tara-KD cells transfected with HA-Tara (B) or YFP-E-cadherin (C) exhibited actin signal intensities similar to the control cells. Bar, 10 µm. (A and B) HA, green; actin, red. (C) YFP, green; actin, red. (D) Scanning electron micrographs of Tara-KD cells with or without transfected HA-Tara or YFP–E-cadherin. The actin filaments of the CR were more loosely packed in the Tara-KD cells compared with the control cells. HA-Tara or YFP–E-cadherin partially restored the packing density of the CR actin filaments. Bar, 5 µm. (E) Electron micrographs of 3D cultures (cysts) of control cells and Tara-KD cells with or without transfection of HA-Tara or YFP–E-cadherin. Thin-section electron micrographs revealed that the spherical cell cysts were composed of a single-layered sheet of epithelial cells. Bar, 2 µm. The vertical-to-horizontal (Z/X) ratio of the diameters of control cell cysts was 0.92 (n = 10). The Tara-KD cell cysts were elliptical, and Tara-KD cells expressing exogenous HA-Tara or YFP–E-cadherin formed spherical cell cysts similar to the control cells. The Z/X ratios of the cell cysts made by Tara-KD cells, Tara-KD cells expressing HA-Tara, or Tara-KD cells expressing YFP–E-cadherin were 0.62, 0.87, and 0.91, respectively (n = 10). (F) Schematic drawing of the novel Tara/Trio RhoGEF/Rac1/p38MAPK/Tbx3/E-cadherin signaling cascade proposed here. This Tara/Trio/Rac1/p38/Tbx3 signaling cascade is the first E-cadherin–based AJ-initiated signal reported to regulate the transcription of E-cadherin in epithelial cell sheets. Here we found that Tara is enriched at AJs through its association with Trio RhoGEF, a binding partner of E-cadherin. By negatively regulating the RhoGEF activity of Trio in an EMT-independent manner, Tara down-regulates the activity of Tbx3, a transcriptional suppressor of E-cadherin. Furthermore, we found that Tara-KD remodeled the actin CR by decreasing the level of E-cadherin expression, although the protein level of cadherin-6 increased. We propose that Tara is a critical regulator of E-cadherin expression, and through this regulation Tara fine-tunes the cadherin-based actin CR and other properties of epithelial cell sheets.

Similar articles

Cited by

References

    1. Abe K., Takeichi M. 2008. EPLIN mediates linkage of the cadherin catenin complex to F-actin and stabilizes the circumferential actin belt. Proc. Natl. Acad. Sci. USA. 105:13–19 10.1073/pnas.0710504105 - DOI - PMC - PubMed
    1. Abrahams A., Mowla S., Parker M.I., Goding C.R., Prince S. 2008. UV-mediated regulation of the anti-senescence factor Tbx2. J. Biol. Chem. 283:2223–2230 10.1074/jbc.M705651200 - DOI - PubMed
    1. Backer S., Hidalgo-Sánchez M., Offner N., Portales-Casamar E., Debant A., Fort P., Gauthier-Rouvière C., Bloch-Gallego E. 2007. Trio controls the mature organization of neuronal clusters in the hindbrain. J. Neurosci. 27:10323–10332 10.1523/JNEUROSCI.1102-07.2007 - DOI - PMC - PubMed
    1. Behrens J., Löwrick O., Klein-Hitpass L., Birchmeier W. 1991. The E-cadherin promoter: functional analysis of a G.C-rich region and an epithelial cell-specific palindromic regulatory element. Proc. Natl. Acad. Sci. USA. 88:11495–11499 10.1073/pnas.88.24.11495 - DOI - PMC - PubMed
    1. Bouquier N., Vignal E., Charrasse S., Weill M., Schmidt S., Léonetti J.P., Blangy A., Fort P. 2009. A cell active chemical GEF inhibitor selectively targets the Trio/RhoG/Rac1 signaling pathway. Chem. Biol. 16:657–666 10.1016/j.chembiol.2009.04.012 - DOI - PubMed

Publication types

MeSH terms